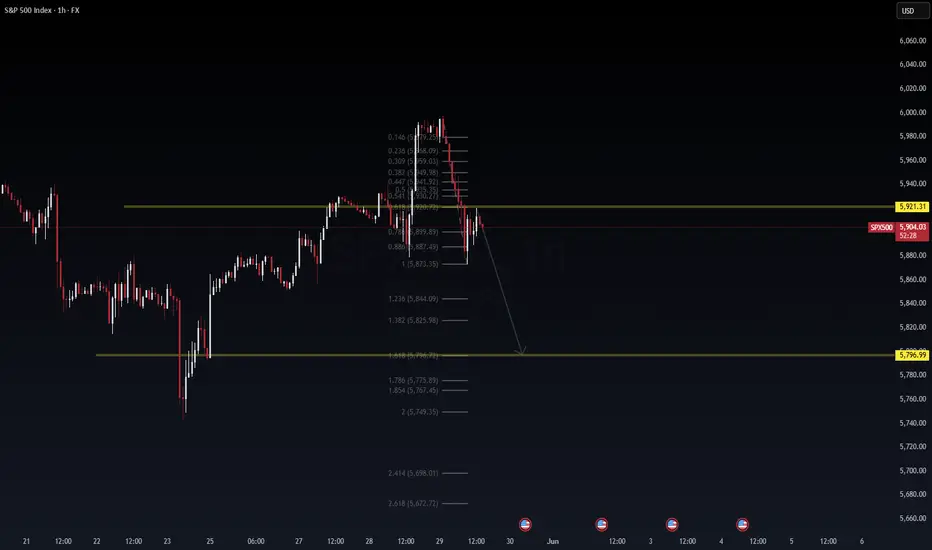
This 1H SPX500 setup highlights a potential bearish continuation pattern following a clear rejection from the 0.618–0.786 Fibonacci retracement zone. Here's a breakdown of the trade thesis:
🔍 Analysis Summary:
Fibonacci Cluster Rejection: Price failed to reclaim 5,921.31 (key resistance) and sharply rejected from the 0.618–0.786 retracement zone.
Bearish Market Structure: Lower highs formed near the .618 Fib, followed by a strong impulsive sell-off.
Liquidity Zone Below: The price is targeting the previous demand block near 5,796.99, a major structural liquidity zone.
Measured Targets (Fibonacci Extensions):
TP1: 1.236 @ 5,844.09
TP2: 1.618 @ 5,796.99
TP3: 2.0 @ 5,749.35
📌 Trade Setup:
Short Entry Zone: 5,915 – 5,921 (retest of resistance)
Stop Loss: Above swing high at 5,932
Take Profits:
TP1: 5,844 (partial close)
TP2: 5,796.99 (main target)
TP3: 5,749 (optional extension)
🧠 Macro Consideration:
With Fed rate uncertainty and bond market fragility, equities may be vulnerable to deeper retracement as institutions de-risk.
Volatility remains elevated heading into month-end—be flexible and risk-aware.
📊 Evidence Supporting the Hypothesis
Resistance at 0.618 Fibonacci Level:
The SPX has approached the 0.618 Fibonacci retracement level, a critical resistance point. A failure to break above this level could indicate a potential reversal or continuation of the downtrend.
Historical Significance of 0.618 Level:
Breaking below the 0.618 Fibonacci support level often signals a continuation of the downtrend, as it is a significant retracement level in technical analysis.
Stalling at Key Fibonacci Target:
The S&P 500's recent rally has stalled near a critical Fibonacci retracement level, raising questions about whether the market is entering a new uptrend or merely experiencing a bear-market bounce.
📉 Implications for Traders
Bearish Continuation: The inability of the SPX to surpass the 0.618–0.786 retracement zone suggests that the recent rally might be a temporary correction within a broader downtrend.
Potential Targets: If the bearish trend resumes, traders might look for support levels at the 1.236, 1.618, and 2.0 Fibonacci extension levels, aligning with the previously mentioned targets of 5,844.09, 5,796.99, and 5,749.35, respectively.
Risk Management: Given the current market volatility and the significance of these Fibonacci levels, traders should employ strict risk management strategies, including setting stop-loss orders above recent swing highs and monitoring for confirmation signals before entering positions.
In summary, the SPX's struggle to break through the 0.618–0.786 Fibonacci retracement levels, combined with historical patterns and recent technical analyses, supports the hypothesis of a potential bearish continuation. Traders should remain cautious and consider these technical indicators when making trading decisions.
📊 Wavervanir International LLC | Discretionary + Quant Hybrid Risk Management
Note
Note
Trade closed: target reached
The first target reached.Note
Disclaimer
The information and publications are not meant to be, and do not constitute, financial, investment, trading, or other types of advice or recommendations supplied or endorsed by TradingView. Read more in the Terms of Use.
Disclaimer
The information and publications are not meant to be, and do not constitute, financial, investment, trading, or other types of advice or recommendations supplied or endorsed by TradingView. Read more in the Terms of Use.