Bollinger Bands weekly
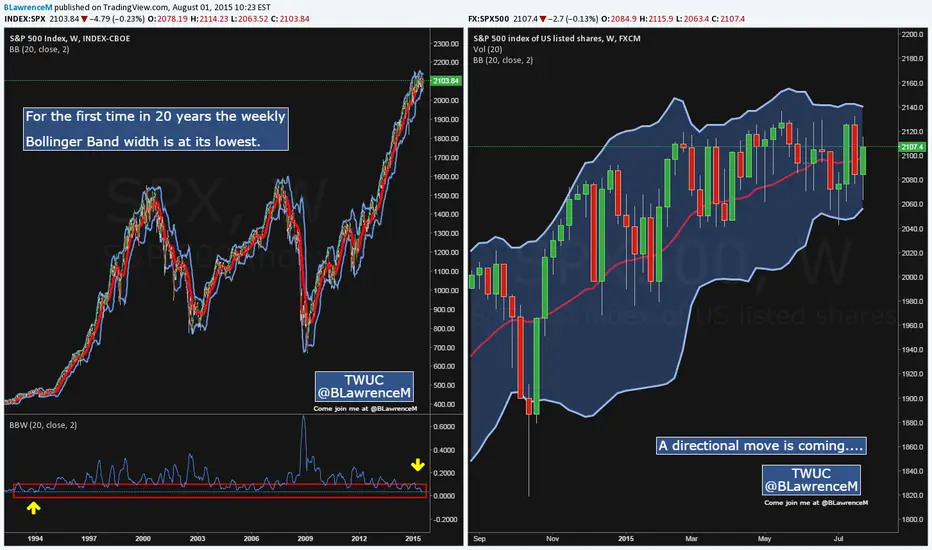
The S&P 500 is locked in a 100 point trading range (2040-2140) since March because of a serious split in sector performance. At less than 5% this is the narrowest range in several years. Note that Bollinger Bandwidth on the weekly chart reached a 20+ year low in July. This means the Bollinger Bands are at their narrowest in over 20 years. How's that for a contraction. John Bollinger theorized that a volatility expansion often follows a volatility contraction. Chartists, therefore, should prepare for significant move in the coming weeks or months.
The upper and lower bands mark the first levels to watch for a directional clue. With the index hitting 52-week highs in February, May and July, the overall trend is up and this favors further upside. I would use the lower Bollinger Band and March-July lows to mark key support in the 2040-2060 area. A weekly close below 2040 would show enough selling pressure to forge a support break and suggest a trend change.
I post my updates on my Twitter profile first.
You can see my 2 latest updates on the SP500 by following this links:
Bearish: twitter.com/BLawrenceM/status/626874602338287621
Bullish: twitter.com/BLawrenceM/status/626915564250886144
TWUC
BLawrenceM
Come join me at BLawrenceM
Best to your trading!
Music at work: Hans Zimmer Thin Red Line:
youtube.com/watch?v=EU2W49eSfW8
open.spotify.com/track/75EaSFMIrDeMxM9bY06EQf
Courtesy Arthur Hill
Disclaimer
The information and publications are not meant to be, and do not constitute, financial, investment, trading, or other types of advice or recommendations supplied or endorsed by TradingView. Read more in the Terms of Use.
Disclaimer
The information and publications are not meant to be, and do not constitute, financial, investment, trading, or other types of advice or recommendations supplied or endorsed by TradingView. Read more in the Terms of Use.