Update for US500.
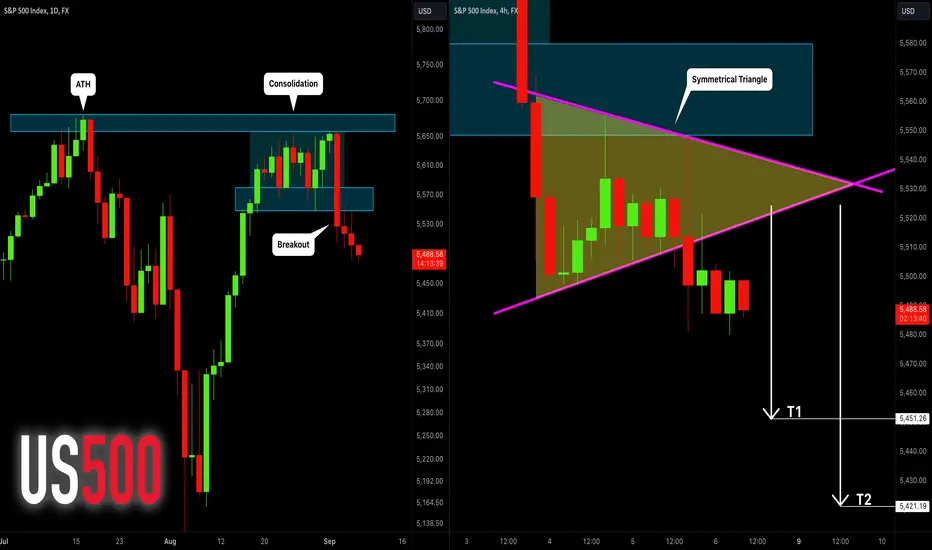
Earlier, we spotted a breakout of a support line of a horizontal
trading range on a daily.
Retesting a broken structure, the market formed a symmetrical triangle
pattern on a 4H time frame.
Bearish breakout of the support of the triangle gives us a strong intraday bearish signal.
We can anticipate a bearish continuation now.
First goal - 5450
❤️Please, support my work with like, thank you!❤️
✅Join My Telegram Channel: t.me/VasilyTrading
❗️YouTube Channel youtube.com/c/VasilyTrader
✅ Facebook: facebook.com/VasilyTrading/
⭐ My Forex & Gold Broker: bit.ly/vasilyforexbroker ⭐
❗️YouTube Channel youtube.com/c/VasilyTrader
✅ Facebook: facebook.com/VasilyTrading/
⭐ My Forex & Gold Broker: bit.ly/vasilyforexbroker ⭐
Related publications
Disclaimer
The information and publications are not meant to be, and do not constitute, financial, investment, trading, or other types of advice or recommendations supplied or endorsed by TradingView. Read more in the Terms of Use.