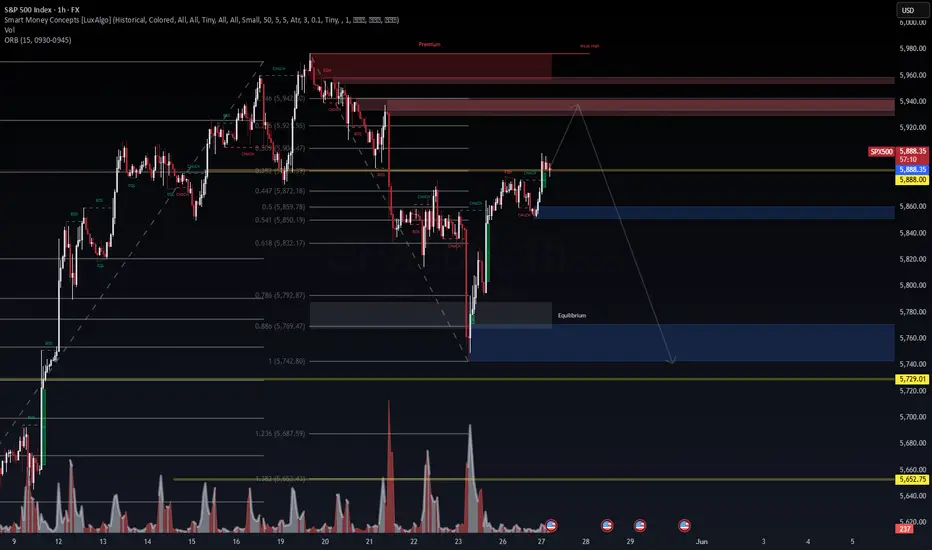
🕒 1H Chart | Smart Money Concepts | Volume | ORB Framework
We are currently trading around 5,888, after a recovery from the equilibrium zone near 5,760–5,770, which served as a strong reaction point. Here's how we at WaverVanir International LLC are assessing probability-based outcomes using our DSS and institutional concepts:
🔍 Key Levels & Observations:
🟥 Premium Supply Zone:
5,925–5,945 shows signs of multiple CHoCHs (Change of Character), BOS (Break of Structure), and prior liquidity grabs.
This zone is now a potential trap for late buyers.
Prob. of rejection: ~70% based on historical confluence.
🟦 Discount Demand Zone:
5,742–5,770 is our equilibrium/discount reaccumulation zone with a high-probability reaction area.
Swept liquidity clean on May 24–27 with volume spike confirmation.
Prob. of support: ~75% short-term if price retraces with exhaustion.
📈 Trade Ideas (Probability-Weighted):
Short Setup (Reactive)
Entry: 5,928–5,940 (inside premium)
Stop Loss: Above 5,950 (above weak high)
Target 1: 5,860
Target 2: 5,785–5,765 (equilibrium zone)
Confidence: 65–70%
Long Setup (Reversion Play)
Entry: 5,765–5,745 (bottom of imbalance)
Stop Loss: Below 5,729
Target 1: 5,859
Target 2: 5,910–5,920
Confidence: 70% if sweep occurs with declining vol.
🔄 ORB Confluence:
Opening Range Breakout (0930–0945) shows recent buy-side aggression, but this move is suspect unless volume continues climbing. A fade below 5,859 without impulsive volume confirms seller re-entry.
Note
Not working!Disclaimer
The information and publications are not meant to be, and do not constitute, financial, investment, trading, or other types of advice or recommendations supplied or endorsed by TradingView. Read more in the Terms of Use.
Disclaimer
The information and publications are not meant to be, and do not constitute, financial, investment, trading, or other types of advice or recommendations supplied or endorsed by TradingView. Read more in the Terms of Use.