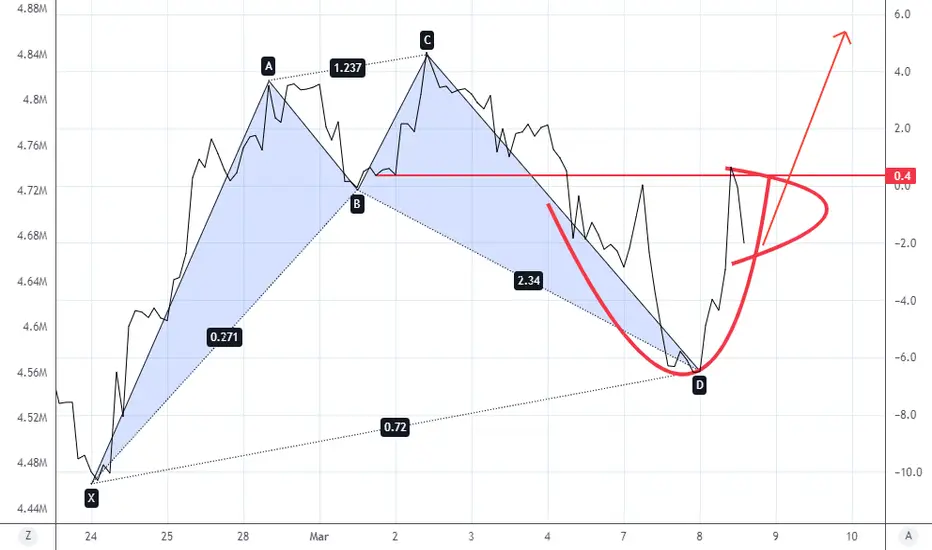
The weekly price action of the S&P 500 is also showing a bullish butterfly pattern. however, for this price action to continue, the lower time frame also must establish the same pattern. In addition, naturally a rejection from B leg, forms a base, and potentially leading us into a high probably cup and handle breakout.
I like to trade the money flow, as it first gives me pattern recognition which I have to later confirm w/ price action ...
not trading or financial advice.
Disclosure im long spxl
I like to trade the money flow, as it first gives me pattern recognition which I have to later confirm w/ price action ...
not trading or financial advice.
Disclosure im long spxl
Note
The AD is showing 4900 spx500 fire up the rocketsNote
ascending triangle set up.. disclosure im long spxl and dustRelated publications
Disclaimer
The information and publications are not meant to be, and do not constitute, financial, investment, trading, or other types of advice or recommendations supplied or endorsed by TradingView. Read more in the Terms of Use.
Related publications
Disclaimer
The information and publications are not meant to be, and do not constitute, financial, investment, trading, or other types of advice or recommendations supplied or endorsed by TradingView. Read more in the Terms of Use.