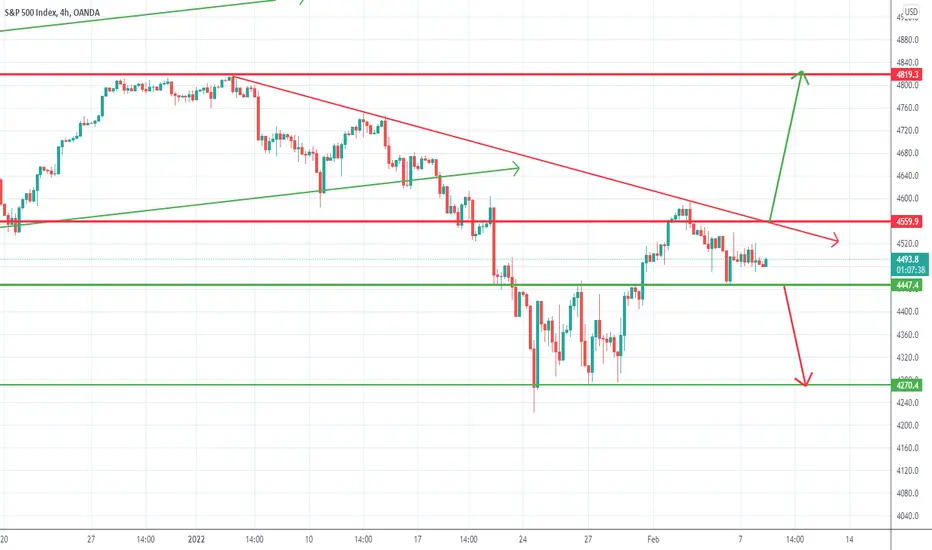
After dropping to 4250 in January, SP500 has started to recover and has risen to 4600 confluence resistance given by a falling trend line and a horizontal level.
A correction followed this move and, again, SP has stopped its descent in 4450 newly formed support.
If the 15% drop from the beginning of the year was just a correction or the beginning of a medium-term downtrend remains to be seen.
What is pretty clear at this point is that as long as the price stays above 4400 we can expect a new leg up and a daily close under this figure would expose the recent low, but more importantly would confirm a lower high at 4600, which is very bearish for the stock market.
P.S: Charts are similar for Dow30 and Nas100
📈 Forex & XAU/USD Channel:
t.me/intradaytradingsignals
💎 Crypto Channel:
t.me/FanCryptocurrency
Related publications
Disclaimer
The information and publications are not meant to be, and do not constitute, financial, investment, trading, or other types of advice or recommendations supplied or endorsed by TradingView. Read more in the Terms of Use.