Hi All,
*** Note: This video is a followup on my previous posting on the SP500 forecast, with measured success. ***
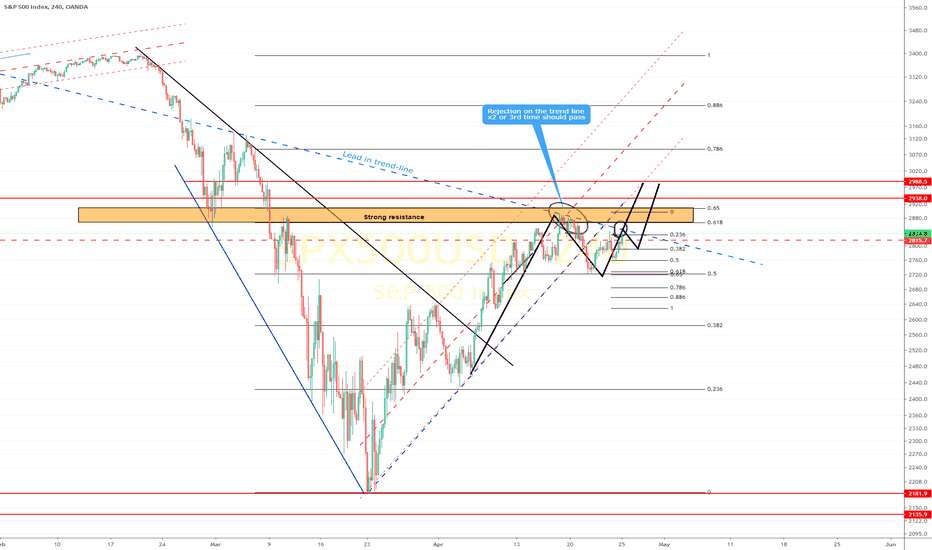
The following video post is my take on the SP500 price action in terms of technical analysis.
If you were to look at my previous posting on this, it gives a background to this video.
But I also recap some of the points in this video.
This video recording is my attempt to explain what I take from the charts, historically and how its applied to the past few months and the next phase of the market.
Please give me a like or a tick for making this effort.
Regards,
S.Sari
My reference: A.Charts
Reference materials:
Bump and Run Chart Pattern Strategy>
tradingstrategyguides.com/bump-and-run-chart-pattern-strategy/
Previous post and a background reference to this video
*** Note: This video is a followup on my previous posting on the SP500 forecast, with measured success. ***
The following video post is my take on the SP500 price action in terms of technical analysis.
If you were to look at my previous posting on this, it gives a background to this video.
But I also recap some of the points in this video.
This video recording is my attempt to explain what I take from the charts, historically and how its applied to the past few months and the next phase of the market.
Please give me a like or a tick for making this effort.
Regards,
S.Sari
My reference: A.Charts
Reference materials:
Bump and Run Chart Pattern Strategy>
tradingstrategyguides.com/bump-and-run-chart-pattern-strategy/
Previous post and a background reference to this video
Note
Note
Note
Note
progress update on the chartNote
chart update: 2 Day chart, on track as forecasted.Note
how are we tracking?Note
The original chart and price update...with a few tweaks.Note
ref. A.ChartsDiscord: discord.com/invite/vb4hbP88vb (TradeToProspa)
Telegram: t.me/TprospaTradersbot
This community has signals now but with no risk management comms.
Telegram: t.me/TprospaTradersbot
This community has signals now but with no risk management comms.
Disclaimer
The information and publications are not meant to be, and do not constitute, financial, investment, trading, or other types of advice or recommendations supplied or endorsed by TradingView. Read more in the Terms of Use.
Discord: discord.com/invite/vb4hbP88vb (TradeToProspa)
Telegram: t.me/TprospaTradersbot
This community has signals now but with no risk management comms.
Telegram: t.me/TprospaTradersbot
This community has signals now but with no risk management comms.
Disclaimer
The information and publications are not meant to be, and do not constitute, financial, investment, trading, or other types of advice or recommendations supplied or endorsed by TradingView. Read more in the Terms of Use.