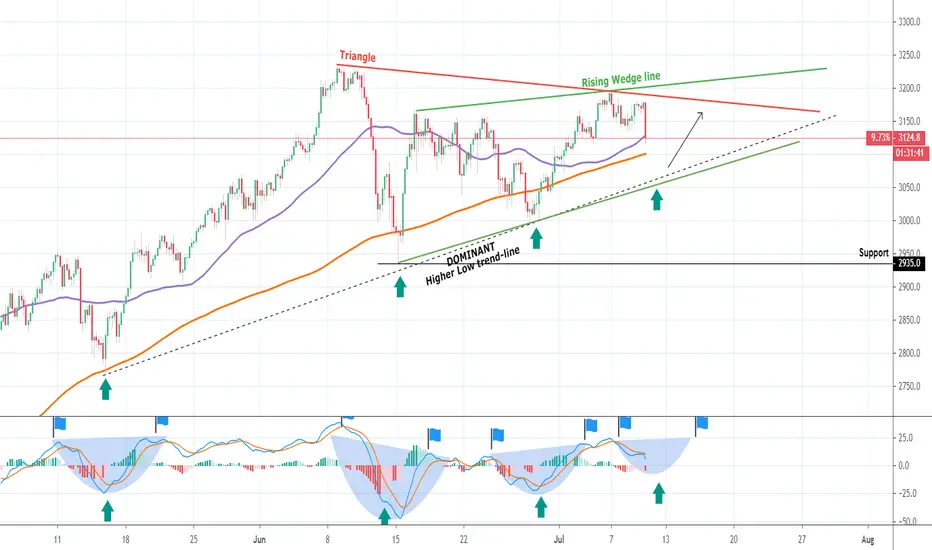
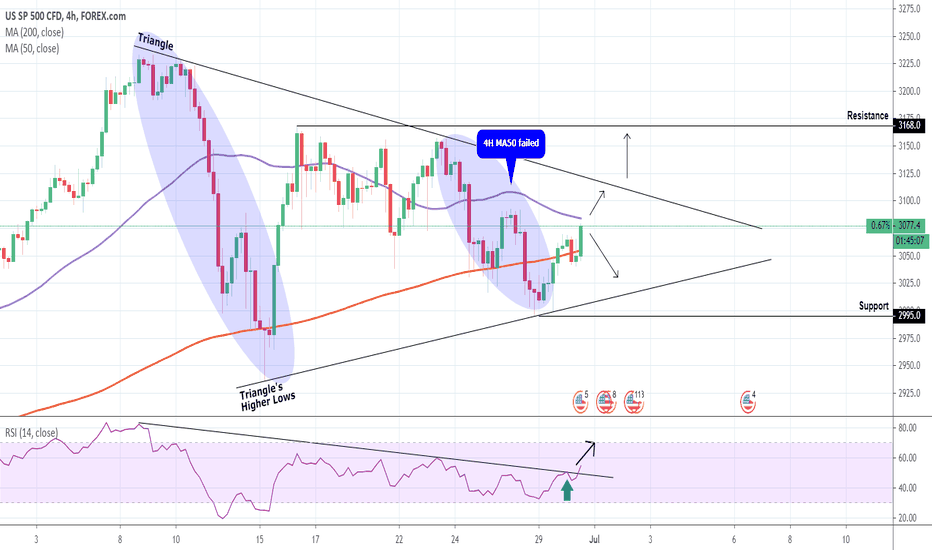
S&P is trading within two formations a Rising Wedge (green lines) clashing on the Lower Highs of a Triangle (red lines) since the June 8th market high. The 4H chart is turning bearish (RSI = 42.335, MACD = 11.360, ADX = 30.843) and that is due to the peak formation on the MACD. As you see on the chart this pattern has been formed three time before since early May and that always delivered a decline on the Dominant Higher Low trend-line (dashed line). We expect a similar decline on that line and once the MACD trends higher again, a rebound.
Former trading signal:
** If you like our free content follow our profile to get more daily ideas. **
Comments and likes are greatly appreciated.
Former trading signal:
** If you like our free content follow our profile to get more daily ideas. **
Comments and likes are greatly appreciated.
Telegram: t.me/investingscope
investingscope.com
Over 65% accuracy on Private Signals Channel.
Over 15% return monthly on our Account Management Plan.
Account RECOVERY services.
Free Channel: t.me/investingscopeofficial
investingscope.com
Over 65% accuracy on Private Signals Channel.
Over 15% return monthly on our Account Management Plan.
Account RECOVERY services.
Free Channel: t.me/investingscopeofficial
Disclaimer
The information and publications are not meant to be, and do not constitute, financial, investment, trading, or other types of advice or recommendations supplied or endorsed by TradingView. Read more in the Terms of Use.