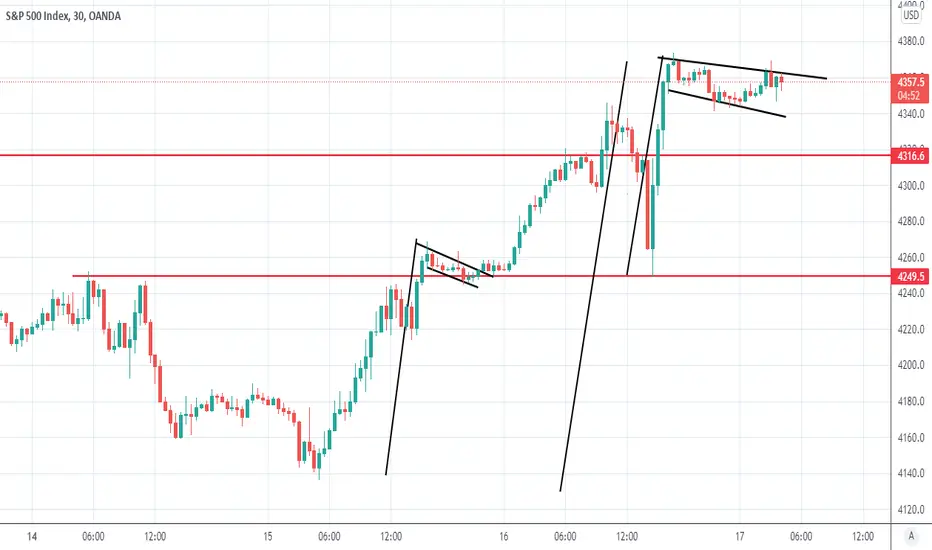
there's at least 3 bull flags alone on just the 30min chart. target remains $4500, then possible correction
Note
Note
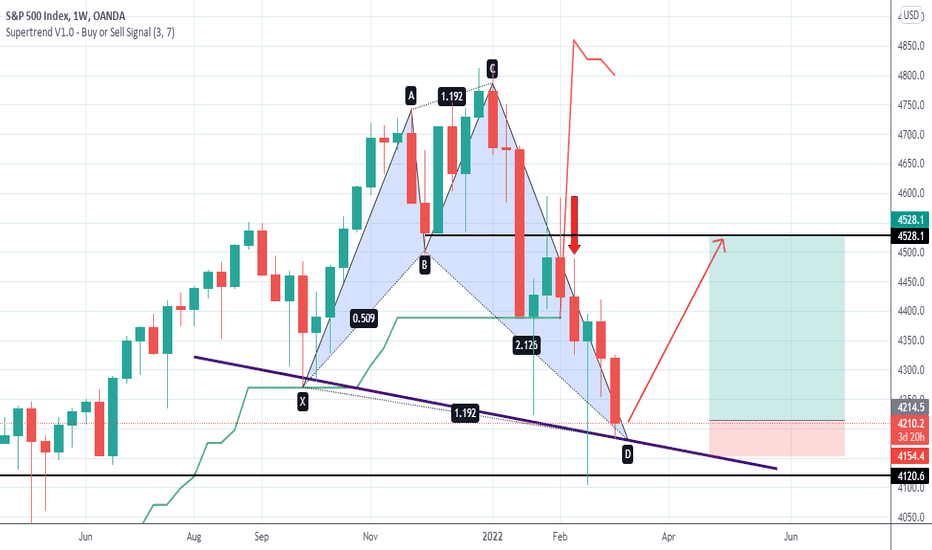
1hr session, looking for the blue line (50ma) to cross over the .618 fib level... I expect an upward movement to 4500 afterwards Trade closed manually
Disclaimer
The information and publications are not meant to be, and do not constitute, financial, investment, trading, or other types of advice or recommendations supplied or endorsed by TradingView. Read more in the Terms of Use.
Disclaimer
The information and publications are not meant to be, and do not constitute, financial, investment, trading, or other types of advice or recommendations supplied or endorsed by TradingView. Read more in the Terms of Use.