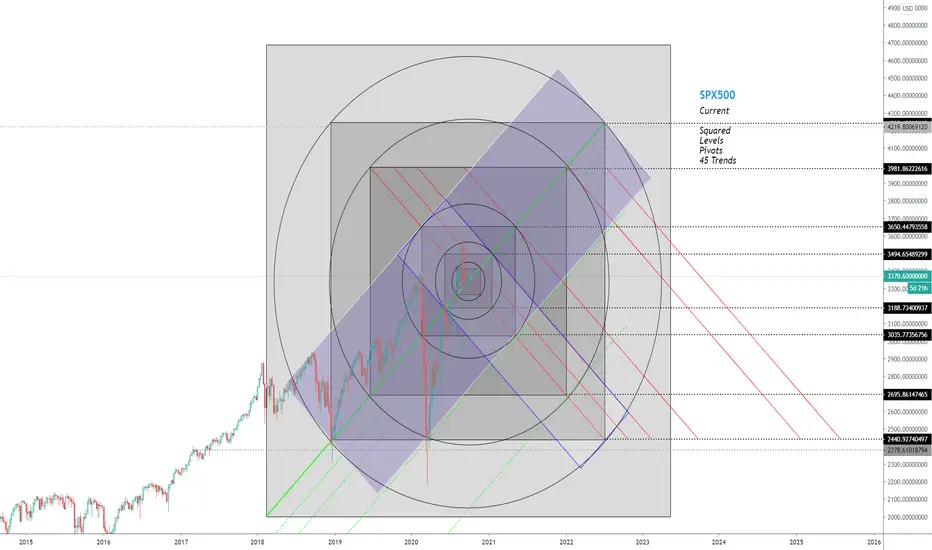
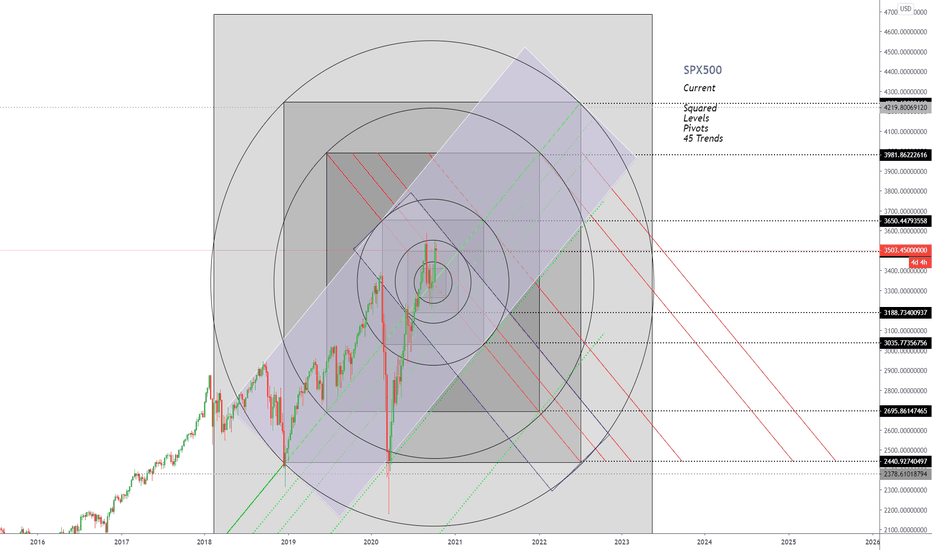
Using Bonfire indicator, I built this chart by request. Finding the square of an asset can really open things up from a visual standpoint. This allows users to bypass scaling variables and helps with finding natural movement, trends , levels and pivots. I often use these charts for confluence along with other indicators to help predict price action vs time. Watch how the price respects, follows, or fails at each line.
Note
Disclaimer
The information and publications are not meant to be, and do not constitute, financial, investment, trading, or other types of advice or recommendations supplied or endorsed by TradingView. Read more in the Terms of Use.
Disclaimer
The information and publications are not meant to be, and do not constitute, financial, investment, trading, or other types of advice or recommendations supplied or endorsed by TradingView. Read more in the Terms of Use.