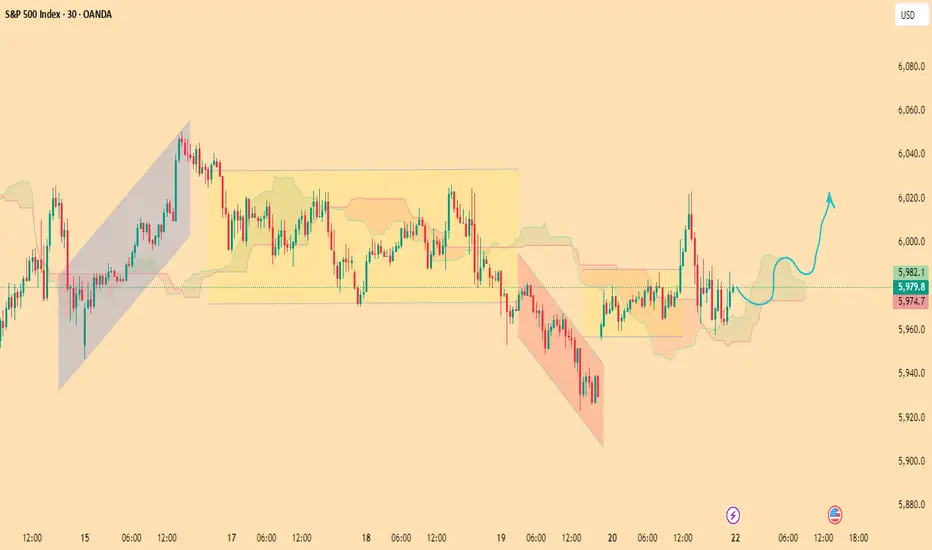
The S&P 500 Index is showing signs of bullish reversal after a period of consolidation inside the Ichimoku cloud on the 30-minute chart. Price previously broke down from a descending channel but found support near the 5,960 level and is now challenging the cloud resistance.
Key technical highlights:
Previous ascending and descending channel structures are clearly defined.
Sideways accumulation zone indicates market indecision and potential buildup.
Price is attempting to break above the Ichimoku cloud, which may signal a bullish trend continuation.
A clean breakout and hold above 5,985 could trigger a move toward the 6,020 resistance zone, as projected.
FREE FREE JOIN TELEGRAM FREE
🔗t.me/+ua3k8HySt11hNmU0
☑️ALL PAIRS SIGNALS
☑️XAUUSD AND CRYPTO SIGNALS
☑️DAILY 3-4 SIGNALS PROVIDE
🔗t.me/+ua3k8HySt11hNmU0
☑️ALL PAIRS SIGNALS
☑️XAUUSD AND CRYPTO SIGNALS
☑️DAILY 3-4 SIGNALS PROVIDE
Disclaimer
The information and publications are not meant to be, and do not constitute, financial, investment, trading, or other types of advice or recommendations supplied or endorsed by TradingView. Read more in the Terms of Use.