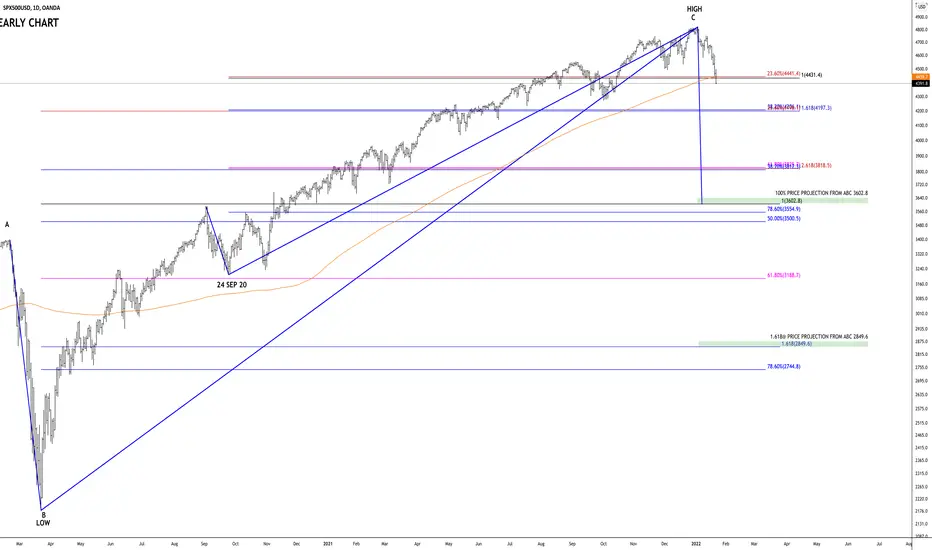
In this chart again i use Fibonacci extension and retracements to have an idea of potential supports as-well as targets zones
price is trading bellow the 200 moving average and could be an indication of a further decline in SP500
a 100% projection would be a 100% symmetry from abc
are we really heading to 3602.8?
let me know whats your thoughts leave me a commend bellow
price is trading bellow the 200 moving average and could be an indication of a further decline in SP500
a 100% projection would be a 100% symmetry from abc
are we really heading to 3602.8?
let me know whats your thoughts leave me a commend bellow
Disclaimer
The information and publications are not meant to be, and do not constitute, financial, investment, trading, or other types of advice or recommendations supplied or endorsed by TradingView. Read more in the Terms of Use.
Disclaimer
The information and publications are not meant to be, and do not constitute, financial, investment, trading, or other types of advice or recommendations supplied or endorsed by TradingView. Read more in the Terms of Use.