S&P 500 Index Reaches New All-Time High
The S&P 500 index set a new all-time high, climbing above the 6,460 mark. The rally in equities is a direct result of yesterday’s CPI report.
According to Forex Factory, the annual CPI remained at 2.7%, whereas analysts had forecast an increase to 2.8%. Moderate inflation readings provide stronger grounds for a Federal Reserve interest rate cut — a move President Trump has been strongly advocating.
Data from the CME FedWatch tool shows that traders now price in a 94% probability of a key rate cut in September, compared to nearly 86% the day before and around 57% a month ago. This prospect of monetary policy easing acts as a bullish driver for the stock market.

Technical Analysis of the S&P 500 Chart
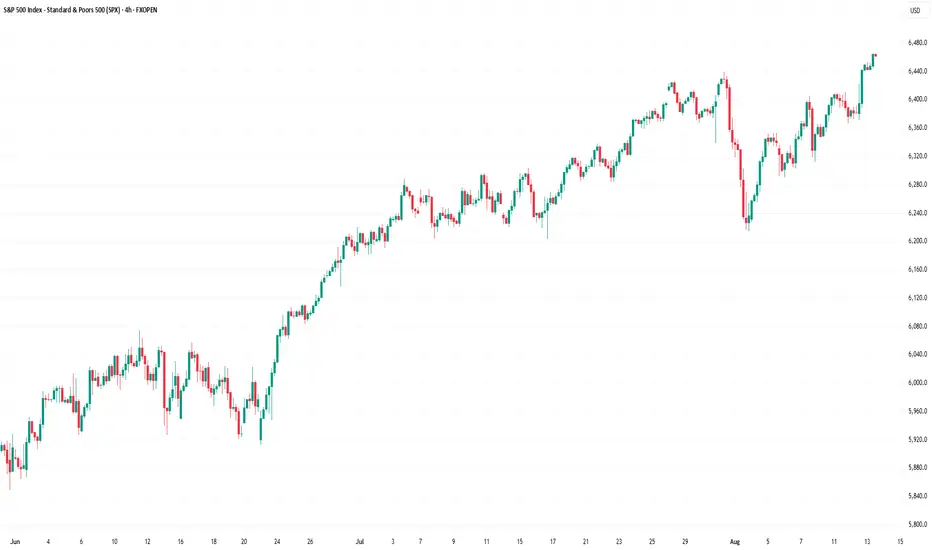
On the H4 chart of the S&P 500, there are grounds to outline an ascending channel (shown in blue). The price is currently in the upper half of the channel — a sign of prevailing optimism in the market.
Following yesterday’s CPI release, the price generated a strong bullish impulse, breaking two resistance levels from below (as indicated by the arrow):
→ August high at 6,406
→ Previous all-time high around 6,440
As a result, these former resistance levels now form the 6,406–6,440 zone. We can assume that:
→ this area may act as support going forward, as buyers clearly held the advantage here;
→ the median line of the ascending channel may also provide support, having shown signs of resistance in early August before being decisively broken on yesterday’s strong impulse.
The RSI indicator is hovering near overbought territory, making the market vulnerable to corrections. However, given the improved fundamental backdrop, any pullbacks might be shallow.
In the short term, the S&P 500 may reach the upper orange line, which defines the growth trajectory from the lower to the upper boundary of the long-term ascending channel. Should the fundamental outlook be further reinforced by positive news — for example, relating to a US–Russia leaders’ meeting — the index could advance towards the upper boundary of the blue channel.
This article represents the opinion of the Companies operating under the FXOpen brand only. It is not to be construed as an offer, solicitation, or recommendation with respect to products and services provided by the Companies operating under the FXOpen brand, nor is it to be considered financial advice.
The S&P 500 index set a new all-time high, climbing above the 6,460 mark. The rally in equities is a direct result of yesterday’s CPI report.
According to Forex Factory, the annual CPI remained at 2.7%, whereas analysts had forecast an increase to 2.8%. Moderate inflation readings provide stronger grounds for a Federal Reserve interest rate cut — a move President Trump has been strongly advocating.
Data from the CME FedWatch tool shows that traders now price in a 94% probability of a key rate cut in September, compared to nearly 86% the day before and around 57% a month ago. This prospect of monetary policy easing acts as a bullish driver for the stock market.
Technical Analysis of the S&P 500 Chart
On the H4 chart of the S&P 500, there are grounds to outline an ascending channel (shown in blue). The price is currently in the upper half of the channel — a sign of prevailing optimism in the market.
Following yesterday’s CPI release, the price generated a strong bullish impulse, breaking two resistance levels from below (as indicated by the arrow):
→ August high at 6,406
→ Previous all-time high around 6,440
As a result, these former resistance levels now form the 6,406–6,440 zone. We can assume that:
→ this area may act as support going forward, as buyers clearly held the advantage here;
→ the median line of the ascending channel may also provide support, having shown signs of resistance in early August before being decisively broken on yesterday’s strong impulse.
The RSI indicator is hovering near overbought territory, making the market vulnerable to corrections. However, given the improved fundamental backdrop, any pullbacks might be shallow.
In the short term, the S&P 500 may reach the upper orange line, which defines the growth trajectory from the lower to the upper boundary of the long-term ascending channel. Should the fundamental outlook be further reinforced by positive news — for example, relating to a US–Russia leaders’ meeting — the index could advance towards the upper boundary of the blue channel.
This article represents the opinion of the Companies operating under the FXOpen brand only. It is not to be construed as an offer, solicitation, or recommendation with respect to products and services provided by the Companies operating under the FXOpen brand, nor is it to be considered financial advice.
Disclaimer
The information and publications are not meant to be, and do not constitute, financial, investment, trading, or other types of advice or recommendations supplied or endorsed by TradingView. Read more in the Terms of Use.
Disclaimer
The information and publications are not meant to be, and do not constitute, financial, investment, trading, or other types of advice or recommendations supplied or endorsed by TradingView. Read more in the Terms of Use.