S&P 500 Sets New All-Time High, Surges Above 6200
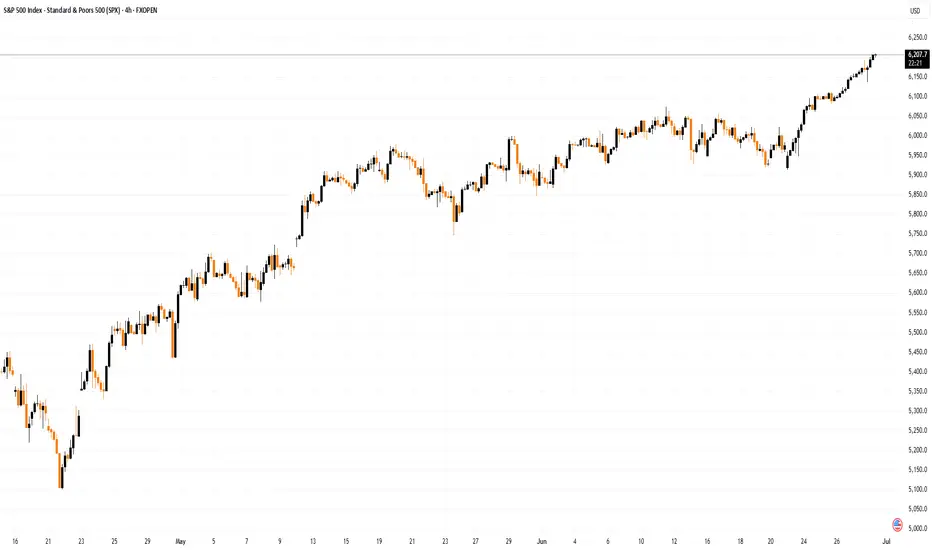
The S&P 500 index (US SPX 500 mini on FXOpen) started the week by reaching a fresh all-time high. As shown on the chart, the index hit 6,210 points earlier this morning.
In addition to a reduced risk of US involvement in a large-scale war in the Middle East, market optimism has been fuelled by:
→ Tariff-related news. Last week, the US President announced the signing of a trade deal with China, while Treasury Secretary Scott Bessent expressed hope that the US would conclude trade negotiations with over a dozen countries by early September.
→ Strong corporate performance. On Friday, Nike (NKE) shares led the stock market, rising by more than 15% following an earnings report that exceeded analysts’ expectations. This could be boosting investor sentiment ahead of the upcoming earnings season.

Technical Analysis of the S&P 500 Chart
Evaluating the 4-hour chart of the S&P 500 index (US SPX 500 mini on FXOpen) in the context of June’s price movements reveals key reference points (marked on the chart) that outline an ascending channel. A consolidation zone, marked with an arrow, highlights a temporary equilibrium between supply and demand—after which buyers gained the upper hand, pushing the price upward.
It is possible that the ongoing bullish momentum could carry the price toward the upper boundary of the channel. However, attention should be paid to the RSI indicator, which suggests the market is heavily overbought; in fact, Friday’s reading marked the highest level of the year. In such conditions, a price correction cannot be ruled out—potentially back toward the local ascending trendline (shown in orange).
This article represents the opinion of the Companies operating under the FXOpen brand only. It is not to be construed as an offer, solicitation, or recommendation with respect to products and services provided by the Companies operating under the FXOpen brand, nor is it to be considered financial advice.
The S&P 500 index (US SPX 500 mini on FXOpen) started the week by reaching a fresh all-time high. As shown on the chart, the index hit 6,210 points earlier this morning.
In addition to a reduced risk of US involvement in a large-scale war in the Middle East, market optimism has been fuelled by:
→ Tariff-related news. Last week, the US President announced the signing of a trade deal with China, while Treasury Secretary Scott Bessent expressed hope that the US would conclude trade negotiations with over a dozen countries by early September.
→ Strong corporate performance. On Friday, Nike (NKE) shares led the stock market, rising by more than 15% following an earnings report that exceeded analysts’ expectations. This could be boosting investor sentiment ahead of the upcoming earnings season.
Technical Analysis of the S&P 500 Chart
Evaluating the 4-hour chart of the S&P 500 index (US SPX 500 mini on FXOpen) in the context of June’s price movements reveals key reference points (marked on the chart) that outline an ascending channel. A consolidation zone, marked with an arrow, highlights a temporary equilibrium between supply and demand—after which buyers gained the upper hand, pushing the price upward.
It is possible that the ongoing bullish momentum could carry the price toward the upper boundary of the channel. However, attention should be paid to the RSI indicator, which suggests the market is heavily overbought; in fact, Friday’s reading marked the highest level of the year. In such conditions, a price correction cannot be ruled out—potentially back toward the local ascending trendline (shown in orange).
This article represents the opinion of the Companies operating under the FXOpen brand only. It is not to be construed as an offer, solicitation, or recommendation with respect to products and services provided by the Companies operating under the FXOpen brand, nor is it to be considered financial advice.
Disclaimer
The information and publications are not meant to be, and do not constitute, financial, investment, trading, or other types of advice or recommendations supplied or endorsed by TradingView. Read more in the Terms of Use.
Disclaimer
The information and publications are not meant to be, and do not constitute, financial, investment, trading, or other types of advice or recommendations supplied or endorsed by TradingView. Read more in the Terms of Use.