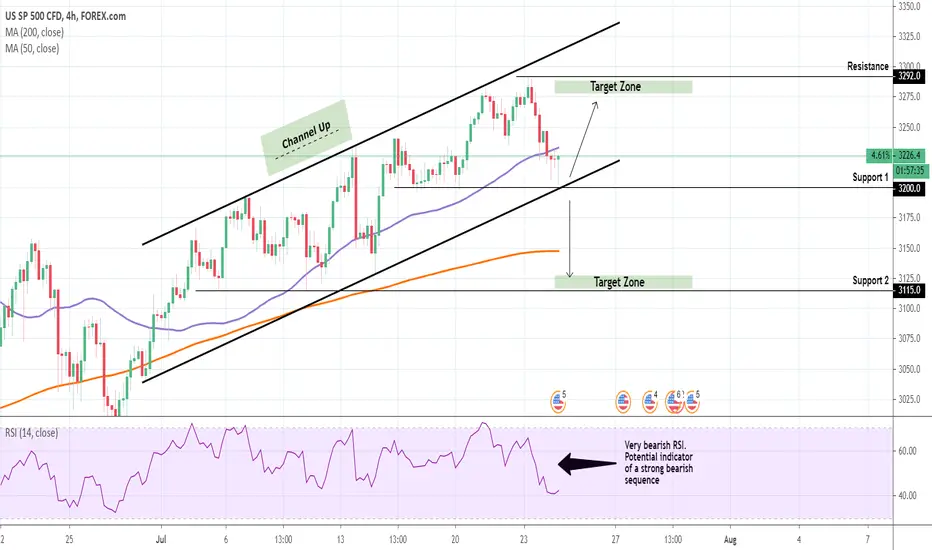
S&P is trading within a Channel Up on the 4H chart (RSI = 43.121, MACD = 1.310, ADX = 35.999) and is right now testing not only the 3,200 Support but also the Higher Low trend-line of the Channel Up.
This is a bullish signal which we are taking and will close within 3,275 - 3,292, which is practically the Resistance Zone. If however the 3,200 Support breaks, we will switch to selling towards the 3,115 Support.
** If you like our free content follow our profile to get more daily ideas. **
Comments and likes are greatly appreciated.
Telegram: t.me/investingscope
investingscope.com
Over 65% accuracy on Private Signals Channel.
Over 15% return monthly on our Account Management Plan.
Account RECOVERY services.
Free Channel: t.me/investingscopeofficial
investingscope.com
Over 65% accuracy on Private Signals Channel.
Over 15% return monthly on our Account Management Plan.
Account RECOVERY services.
Free Channel: t.me/investingscopeofficial
Disclaimer
The information and publications are not meant to be, and do not constitute, financial, investment, trading, or other types of advice or recommendations supplied or endorsed by TradingView. Read more in the Terms of Use.