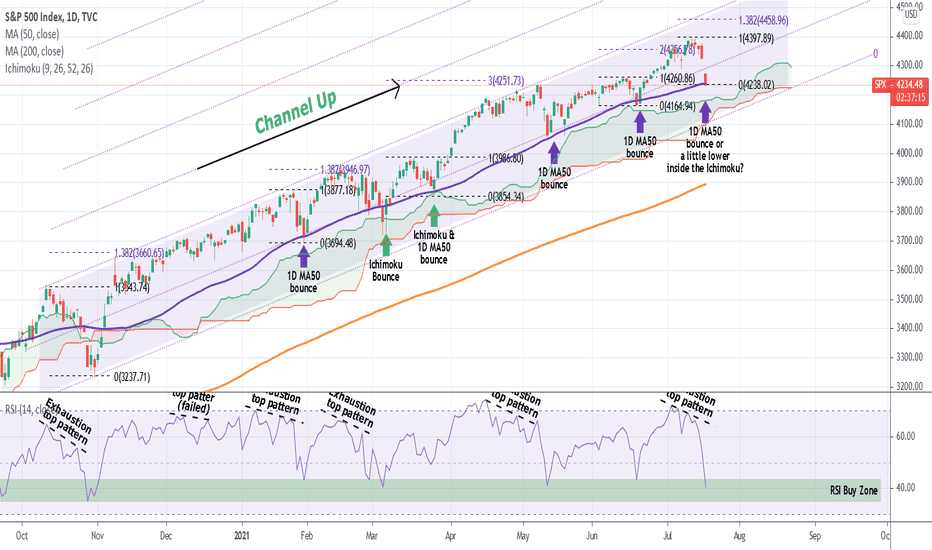
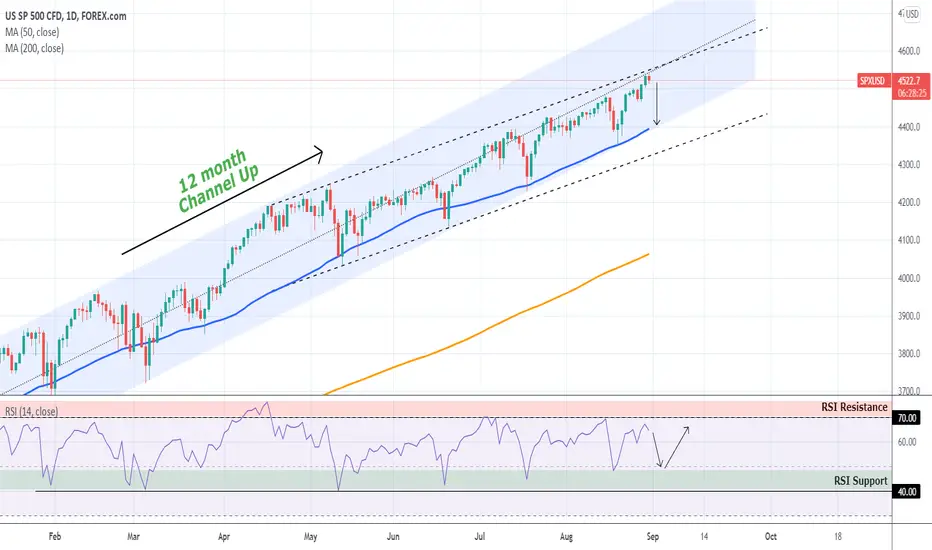
S&P500 has been trading within an almost 1 year long Channel Up ever since the U.S. elections. The pattern has been quite consistent especially in "buy the dip terms" as every hit on the 1D MA50 (blue trend-line) has been an optimal buy level for so long. That has been the strongest aspect of my strategy, last time I shared it was on July 19:

Right now the index is not on the 1D MA50 but there is a pattern that has given accurate "sell the top" signals also: the RSI on the 1D time-frame. As you see on the main chart, every time the RSI hits (or marginally approaches) the 70.000 Resistance level, it marks a top and waves a sell signal.
Naturally I expect the continuation of this pattern with a pull-back to the 1D MA50, where new buys can be placed.
** Please support this idea with your likes and comments, it is the best way to keep it relevant and support me. **
--------------------------------------------------------------------------------------------------------
!! Donations via TradingView coins also help me a great deal at posting more free trading content and signals here !!
🎉 👍 Shout-out to TradingShot's 💰 top TradingView Coin donor 💰 this week ==> vychod
--------------------------------------------------------------------------------------------------------
👑Best Signals (Forex/Crypto+70% accuracy) & Account Management (+20% profit/month on 10k accounts)
💰Free Channel t.me/tradingshotglobal
🤵Contact info@tradingshot.com t.me/tradingshot
🔥New service: next X100 crypto GEMS!
💰Free Channel t.me/tradingshotglobal
🤵Contact info@tradingshot.com t.me/tradingshot
🔥New service: next X100 crypto GEMS!
Disclaimer
The information and publications are not meant to be, and do not constitute, financial, investment, trading, or other types of advice or recommendations supplied or endorsed by TradingView. Read more in the Terms of Use.
