SPX-----
Structure Detected
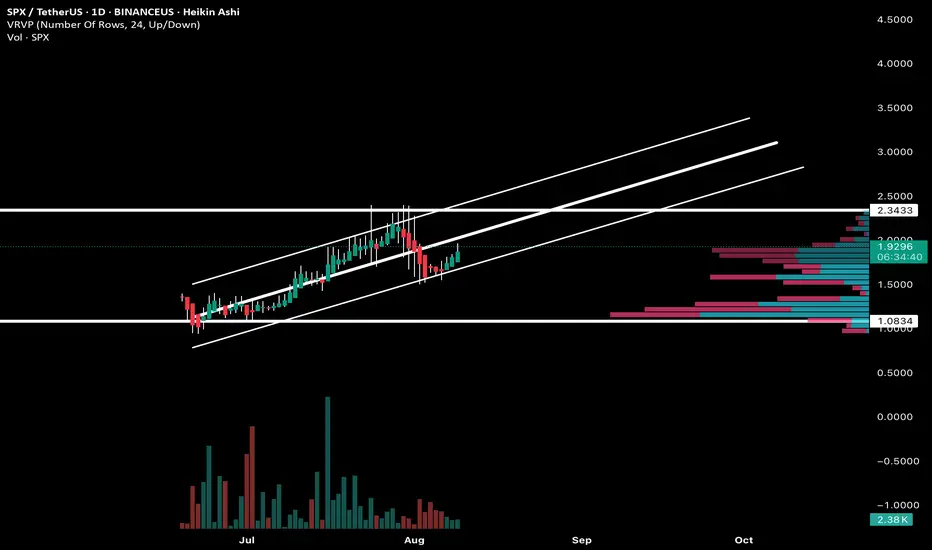
Price is in a rising parallel channel with multiple touches on both upper and lower trendlines — a sustained bullish structure since the left side of the chart.
Recently, price pulled back to the lower channel boundary and is now bouncing upward.
There’s a horizontal resistance around 2.3433 and a major support base near 1.08.
Volume profile (VRVP) shows high-volume node around the current price (1.93), meaning this area has been heavily traded — often a pivot zone.
The recent candles show consecutive green Heikin Ashi candles, indicating current bullish momentum after the correction.
Market Bias
Short-term: Bullish (rebound from lower channel, green candles, reclaim attempt of mid-channel).
Medium-term: Still bullish while inside the ascending channel, but caution near the 2.34 resistance as it’s been a rejection zone before.
Bullish Targets
2.00 – 2.05 → reclaim and hold to confirm momentum.
2.34 (major resistance and top of volume profile) — key breakout point.
If 2.34 breaks with conviction, upside targets move toward ~2.80 – 3.00 (upper channel).
Bearish Levels / Invalidation
First warning if price closes back below ~1.75 (loses mid-channel support).
Strong breakdown confirmation if 1.50 fails (mid-volume node).
Full structure breakdown below 1.0834 — would invalidate the bullish channel.
🕰️ Timeframe-Based Targets
Daily Swing Targets:
Upside: 2.00 → 2.34 → 2.80
Downside: 1.75 → 1.50 → 1.083
Summary:
SPXUSDT is still in a broader uptrend channel and is currently bouncing from the lower boundary. The immediate battle is reclaiming the 1.93–2.00 zone to set up a run toward 2.34. A rejection there could send price back toward 1.75–1.50, but until the lower channel breaks, the structure remains bullish.
Structure Detected
Price is in a rising parallel channel with multiple touches on both upper and lower trendlines — a sustained bullish structure since the left side of the chart.
Recently, price pulled back to the lower channel boundary and is now bouncing upward.
There’s a horizontal resistance around 2.3433 and a major support base near 1.08.
Volume profile (VRVP) shows high-volume node around the current price (1.93), meaning this area has been heavily traded — often a pivot zone.
The recent candles show consecutive green Heikin Ashi candles, indicating current bullish momentum after the correction.
Market Bias
Short-term: Bullish (rebound from lower channel, green candles, reclaim attempt of mid-channel).
Medium-term: Still bullish while inside the ascending channel, but caution near the 2.34 resistance as it’s been a rejection zone before.
Bullish Targets
2.00 – 2.05 → reclaim and hold to confirm momentum.
2.34 (major resistance and top of volume profile) — key breakout point.
If 2.34 breaks with conviction, upside targets move toward ~2.80 – 3.00 (upper channel).
Bearish Levels / Invalidation
First warning if price closes back below ~1.75 (loses mid-channel support).
Strong breakdown confirmation if 1.50 fails (mid-volume node).
Full structure breakdown below 1.0834 — would invalidate the bullish channel.
🕰️ Timeframe-Based Targets
Daily Swing Targets:
Upside: 2.00 → 2.34 → 2.80
Downside: 1.75 → 1.50 → 1.083
Summary:
SPXUSDT is still in a broader uptrend channel and is currently bouncing from the lower boundary. The immediate battle is reclaiming the 1.93–2.00 zone to set up a run toward 2.34. A rejection there could send price back toward 1.75–1.50, but until the lower channel breaks, the structure remains bullish.
Disclaimer
The information and publications are not meant to be, and do not constitute, financial, investment, trading, or other types of advice or recommendations supplied or endorsed by TradingView. Read more in the Terms of Use.
Disclaimer
The information and publications are not meant to be, and do not constitute, financial, investment, trading, or other types of advice or recommendations supplied or endorsed by TradingView. Read more in the Terms of Use.