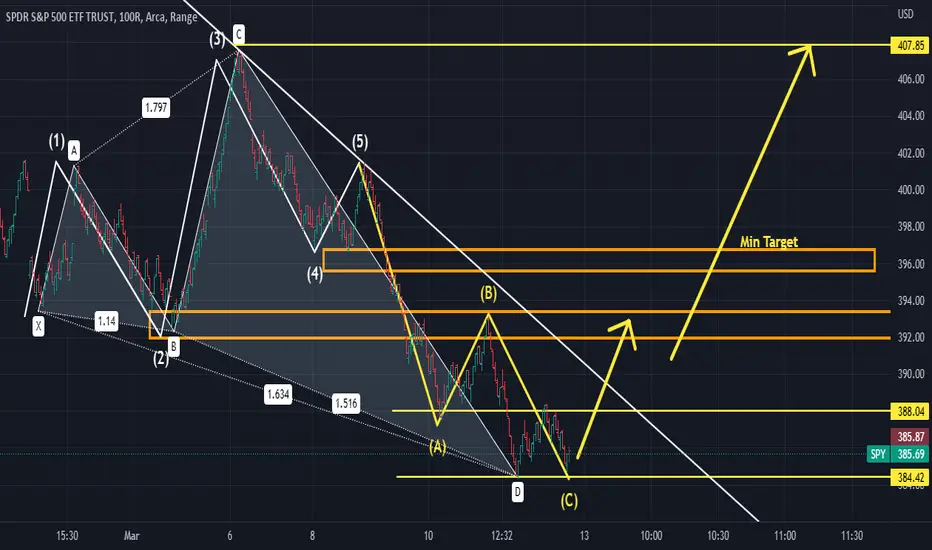
Previous resistances could then act as support to launch to $408.00. From Wave 1- Leg A, is a bullish Cypher pattern. B Leg was the rejection as it retrace back up to Wave 2. Double bottom occurred on the intraday Friday. A leg acted as resistances before the double bottom occurred. This information combined w/ my Technical Analysis on Tech, and Financial Sector I see the SP500 rally early next week and cause a short squeeze.
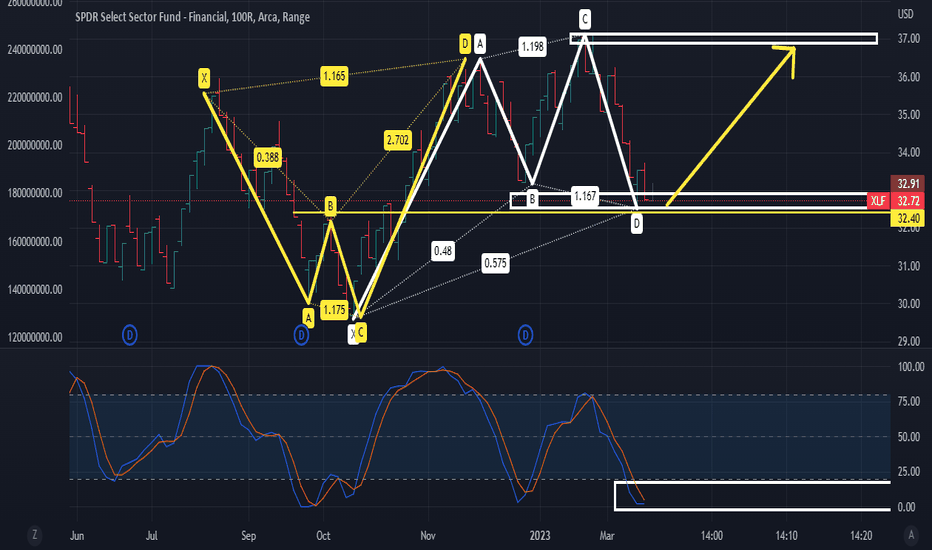
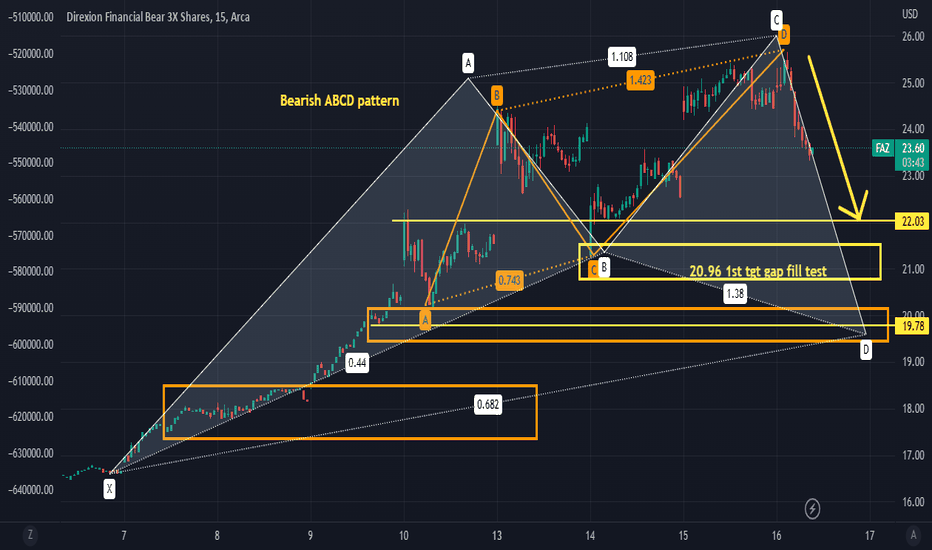
Looking to long Financials early next week, any negative news in the market is a buy opportunity. I also like Tech, and will likely short the inverse 3x bear etf
Looking to long Financials early next week, any negative news in the market is a buy opportunity. I also like Tech, and will likely short the inverse 3x bear etf
Note
Double Bottom by the AD + Stoch RSINote
im also anticipating financials to rally next week.Note
Note
All 3 have double bottom on the 5min chart w/ an oversold stoch rsAD + Price Action + Chikou Span. Looking for retest of short zone $398
if valid, we move to higher time frame on 15min chart to retest that short zone
Note
stoch rsi still below the cloud in oversold territory Note
Big Buyer tonight on sp500 futures.Same Triple Bottom AD + Price Action + Chikou Span, retest short zone
Note
1hr view of spy. previous support will likely act as resistance, but expect to move higher Note
to retest short zone 398 next weekNote
looking for a bottom intraday tomorrow morning Note
shorting into the opening on futuresNote
Note
Note
then decision at 3876Note
took profits on the short Note
bear trap this morning. I'm out of my shorts. Currently seeing a rounding top, the C leg hasn't been invalidated. Everything is going to plan so far. I will be buying puts and shorting inverse Bear ETFS like Note
bought Faz $22 puts, puts SPXS $20.5, puts SPXS $19Note
Looking for AD to breach this level, and price action respond to a move to $392.5 for Note
Note
looking for a bull flag breakout here Note
bull flag breakout confirmed (removed the pitchforks) new target is 392.50 on spy.. Note
The AD is approaching an apex, and nearing a a breakout/directional point. Note
Price Action will continue to spike, as the AD approaches Key fib levels on this time frame. I believe the bottom is in for todays trading session.. lets make some money Note
All Things consider, I see today as a win for the bulls. Low of the Day held, on good volume. Big numbers tomorrow. here is a brief update before futures start trading tonight. Here is
Note
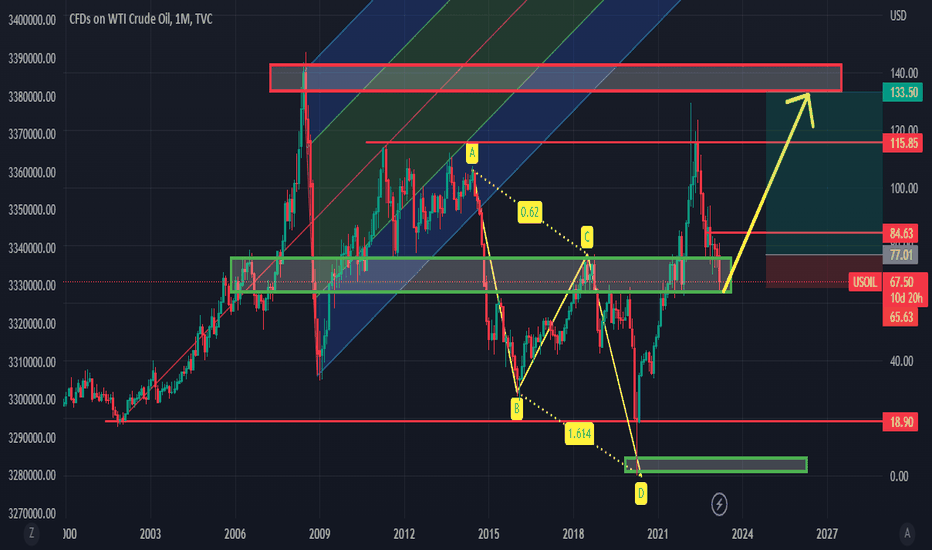
I ran an inside pitch fork from ( B leg t to C leg) of the Yellow ABC pattern. After reviewing this pattern, there is an ABCD pattern inside of this on the right side of the bullish cypher (In Gold). The intent wasn't to get the math sequence correct, but to illustrate what im seeing. A bullish Move from the D leg of the bullish cypher, would set up a retest to B leg or wave 2 of the Eliott wave. The ABCD pattern also confirms this set up. Price action could stay rising according to the pitch form and then we get directional point as we get closer to 395-398Note
i'll be monitoring this Inverse head and shoulders set up on futures tonight for completion going into tomorrow..Note
Note
False Head and shoulders on sp500 emini futuresNote
the pitch fork helped id the ABCD set up Note
1min (bearish into close)
Note
I will be monitoring the AD and the Money flow at the opening bell, the 1st 30min to determine if the AD will breach the 30min spike levelNote
All Systems appear to be a go. Lets get this money today. Puts will print, and Note
AD showing 30min spike I mentioned in above chart, but we'll likely see that move before US markets open at 930am Note
30min spike level breach Note
retest short zone of $398.5, 1st area of resistances is $392.5Note
inverse head and shoulders breakout, look for this pattern to continue onto higher time frames. we need to clear 392.5, to set up the run to 398.50-400 later this week. If pattern is true and valid there will be more volatility on the higher time framesNote
$398 spy is magnet nowlook for AD to cross $392.50 level and push to $398
Note
You dont need to see price action to trade. Here is the AD going through Key fib levels. Notice on the 15min chart we're approaching the .236 fib level by the AD. All I did was measure the height of the highest sell off $407.00 to the bottom of this range. As the AD approaches these key fib levels, you'll see more spikes in price actionNote
I don't have a website, or discord. I'm getting a lot of questions about this. If you have a specific question about a stock/etf/commodity and wish for me to chart it. Drop me a message. I'll do it for a fee which you can send via paypal. I'm keep charting If you're having success using the charts and want to support feel free to drop a tip, also if you want me to chart a certain stock for you. Send a tip with a message and your TV username and i'll do it for you. (DM me before so I know)
paypal.me/FlippingnStacking?country.x=US&locale.x=en_US
If there is enough interest in a discord, i'll consider starting one. Thanks again for the likes and comments
Note
As we climb higher, the fibs which were determined by the AD, need to be retested as support levels. I.e. .236 fib, then the .382 fib level etc.. you should see a retest on every time frame. You want to see this in a bullish environmentNote
AD + Stoch RSI double bottom same level. right near the .236 fib level 390.90Note
adding more at the 390 level, 5min dbl bottom by AD + Stoch RSI and previous resistances level acting as supportNote
jpm and apple wont let this market crash. see my Note
same fib levels that I posted on the 15min chart over 7 hours ago.. Look at how Price Action responded Note
Price action spiked towards the end of the day as the AD crossed up through these levels on the fib. Now im keep these same fib levels, and jump to the 1hr time frame to show what im seeing.Note
1hr chart. The AD is showing me an Inverted head and shoulders pattern set up. The AD (in White) has already crossed over the lower fib level . If you scroll up and review the 5min chart, there was a smaller inverted head and shoulders breakout that retrace.Note
if you recall last night, I spoke about the ABCD bullish pattern I saw on ES sp500 emini futures. The same pattern is present here. The Head and Shoulders on the 1hr (everyone saw) is part of this bullish pattern. For every bullish pattern, there is a bearish component Note
We have to get over $401.5 to invalidate that head and shoulders. I'm stating price action is going to run above $407.. I'm sticking to the 398.50, you dont have to keep asking me that.. and this is the reason whyNote
same similar pattern I saw last night before the pop Note
Note
last update, multiple levels of IHS seen on futuresNote
there it is. 4080 confirmed by the AD, we have an Ascending triangle. Im fully anticipating $400 this week Note
and once this level is breached, then im consider taking a short. AD + price action would then be at the same height. It would likely form a double top. But first let the price action catch up. Cheers..Note
1hr update for Note
same also seen on 1min time frameNote
waiting on confirmation of this desc. triangle breakout make or break for price action Note
desc. triangle breakout Note
Note
higher highs/ higher lows being created Note
AD showing we're about to spike into the close, and regain all the selling pressure from last week if we can close above trendline resistances here.Note
Note
sp500 3x bear etf Note
see the rounding top Note
should close on or above support Note
closed above support, thats a win in my bookNote
Note
Note
something to consider... if we clear 3940 we head to 4080, there are two sets of head and shoulders patterns. Not sure we invalidate both, but I can see us invalidate the 2nd h/s in red box.. 4080 level takes out that right shoulder Note
Note
make or break day Note
Note
posted 2hr ago, support level held up nicely... we takeout 3940-3950 we will soar to 4080 Note
aight might be the last chart for this trade.. im looking to take profits when Note
weakness on short the C leg of the bullish cypher on
Note
prev. resistances acting as support Note
prev. resistances acting as support.. A strong close above A leg or C leg is extremely bullish Note
maybe a little greedy, but I want to see a $396 retest into the close today Note
bull flag Note
there it is $396, push to $398 close? nah that might be asking for too much. enjoy those profitsNote
futures cup and handle forming here, waiting for confirm breakout.. also 30min stoch rsi is almost below cloud (we've seen bullish momentum from this move this week already both on 1m/1hr chart)Note
Note
notice how when the Stoch RSI is under the cloud, those have been buys. with previous resistances acting as support now, stoch rsi may not dip below the cloud. Keep that in mindNote
spx closed above previous resistances level during NY session, I actually want to see it retested during futures and hold. And gradually rise going into NY open. But if there is no retest from D leg of the abcd pattern (in white) to A leg (top of the bullish cypher) than that's extremely aggressive bullish behaviorNote
buy signal right in front of you on the futuresNote
mentioned it earlier, looks like we're going to get that 3941 retest before NY open. Previous resistances to hold as support.. Note
I set a stop loss for the futures short, but overall im bullish. I've stated my view thoroughly enough. Im not going to be up all night trading, gotta get some restNote
i'll take 3945 even..Note
Note
covered the short, and we bear hunting nowNote
all the answers you need and looking for are right here in Note
spy will eventually move back up due to the heavy short of the 3x bear sp500 etf...Note
here it is Note
this weeks trend still in tact. 1hr chart still very bullish. stoch rsi in oversold territory and below cloud (very bullish) Note
Note
Note
Note
apex on 3min futures Note
keep an eye out for for Note
follow tsla chart for live updates, safe buy is above $215 which would validate the cup/handle breakout set up 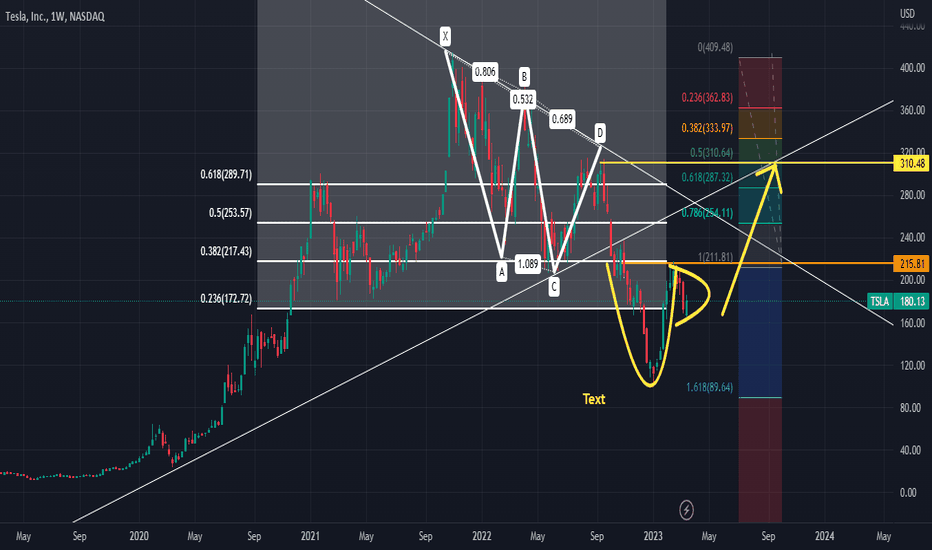
Note
Volatility coming back into the markets even stronger... looking for a flush on Note
Bull flag on Note
Note
Nice gap up above the Apex.. within range of my target. Could easily hit $401, thanks for following my trades and Ideas. I'm closing this trade once target hits, all though this could still run up. I just wont be giving anymore updates.. CheersTrade closed: target reached
Target reached at the open this morning. We saw $398, market looks bullish.. as of now im closing the trading idea. CheersNote
my last gift for this trade Note
broke out Trade closed manually
No more updates will be provided...Disclaimer
The information and publications are not meant to be, and do not constitute, financial, investment, trading, or other types of advice or recommendations supplied or endorsed by TradingView. Read more in the Terms of Use.
Disclaimer
The information and publications are not meant to be, and do not constitute, financial, investment, trading, or other types of advice or recommendations supplied or endorsed by TradingView. Read more in the Terms of Use.