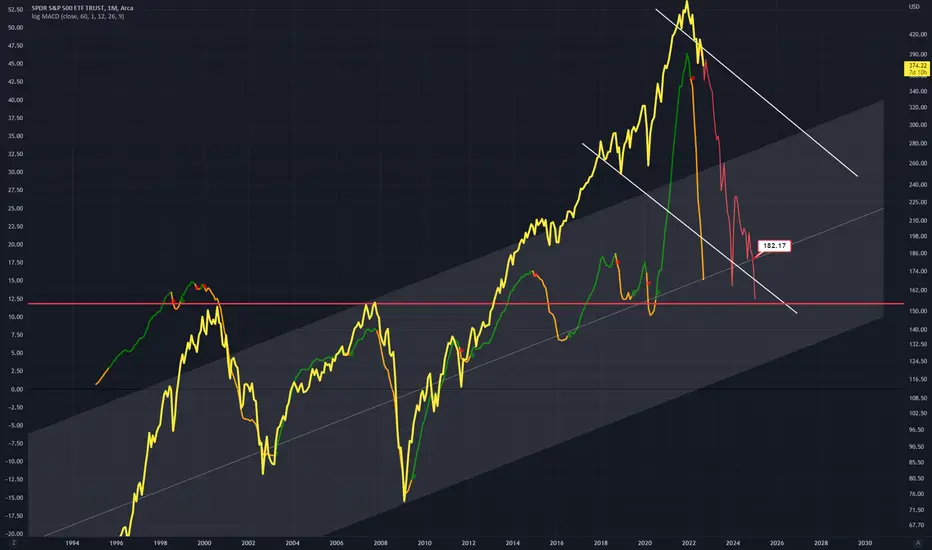
I have drawn an Up Channel here showing the overextension of SPY
A Horizontal can be drawn (in red) that shows a strong support point for price if decline occurs.
The MACD on chart shows the current bear decline state price is in (in orange)
The MACD in my opinion is also very over extended and this orange state will likely continue
A Horizontal can be drawn (in red) that shows a strong support point for price if decline occurs.
The MACD on chart shows the current bear decline state price is in (in orange)
The MACD in my opinion is also very over extended and this orange state will likely continue
Disclaimer
The information and publications are not meant to be, and do not constitute, financial, investment, trading, or other types of advice or recommendations supplied or endorsed by TradingView. Read more in the Terms of Use.
Disclaimer
The information and publications are not meant to be, and do not constitute, financial, investment, trading, or other types of advice or recommendations supplied or endorsed by TradingView. Read more in the Terms of Use.