Lets just few the picture and let it tell us a 1000 words.
Everyone says to the moon...Just like 2009, up we go....Just like 2020, up we go
But let us view it another way...eh?
You "stole/froze" whatever you label it...Russian Assets and kicked them from Swift, which they return the favor by arguing that the ceasefire deal cant be done cause they don't like the style of pen you brought that day....
You decided to show the the world that you will turn a certain area of the Mediterranean into a French Plaza with beach front hotels, and may...maybe give the inhabitants vouchers to move away- one can say its a booming deal for them.
You decide to demonstrate to the world that on a tweet's notice you will change policy without official announcements and policy update for the rest of the world.
Then you decide...well I think that picture is becoming clear- Japan just bit the hand of Uncle Sam and said 'if you step any closer the treasuries get it'
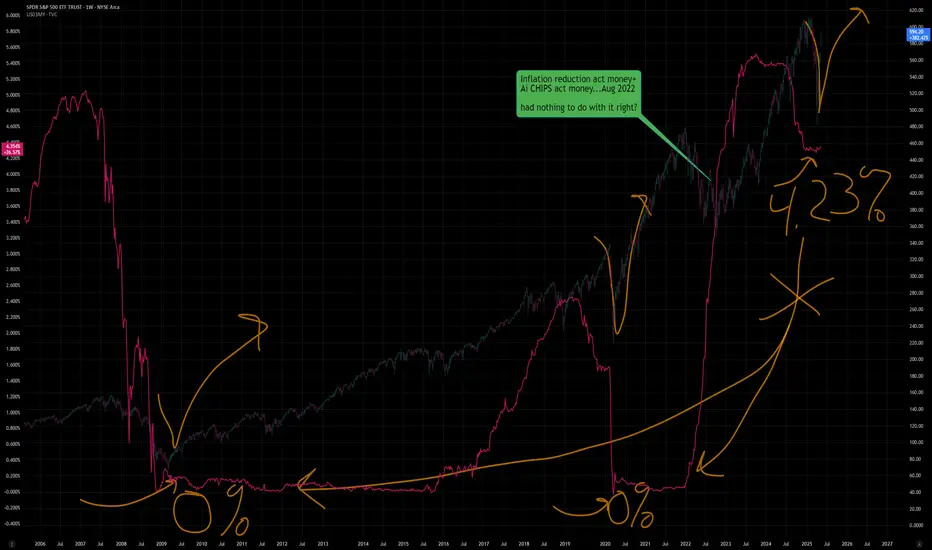
So in all, the rally to ATH is literally exactly like 2009 and 2020, since there is literally nothing that has changed and everything above was equally going on, just change the dates and the people/places involved but exactly the same right.
Except for that weird number 0...0% which seemed to occur in 2009 and 2020- no coincidence there and todays 4.3% means absolutely nothing...just slight inflation, roughly 12-13k % increase...but its no issue.
So what can we surmise here....:
Well you were dropping for a good amount of time in 2009- ~504 days and in 2020 you basically turned the lights off and then on again...so that seems to fit with what just happened here right>>
you had 282 days of drop in 2022, which is 56% of 2009 and you literally made up a number of tariffs, then made up a lower number a month later and bingo-bango back up you go....
butttt...one of these things in pink just doesn't quite fit...so honestly it will be a delight to see how the see-saw theory works:
I call it a theory cause there is no proof on the chart that when the market goes up- yields go up, no case for it and not visible on the chart anywhere....So we should be good. Ergo....
As the market makes ATH and keeps charging up, the yields will go back down to 0% or so on the 3month and stay there cause that follows the see-saw theory. You don't keep money in the markets for too long as they rise, you rotate it into the treasuries cause you get a better stable return.
So...Trump and Bessent win...getting lower yields and a higher stock market- cause just look at the Technical Analysis everyone- there is only emotion in people saying Yields go up as the S&P goes up, its not cold hard logical facts right...only emotional people think stocks make yields go up..jeez
----
If you agree with the last bit there...you may need to check your local big city, over 2-3million inhabitants, to see how you are doing in these ATH markets....you may find that when treasuries are up....you arent doing so well on the street..
You can lie to a Tiger and say according to the charts you are more advanced than him and you will, according to the charts, beat him due to your superiority. He however lives in reality and wonders why you are talking to him and showing him a paper- so he offs you and walks away- feeling nothing cause you were the emotional one trying to use a chart to tell nature what it isn't. :)
be careful out there...cause V-bottom explosions need a 0 or close to 0% interest rate...and 4.3 isn't 0, so study an elliot wave guy and see if this isnt what is called the "B-wave" where you may settle back in the 400 range soon..and low 400 at that.
Everyone says to the moon...Just like 2009, up we go....Just like 2020, up we go
But let us view it another way...eh?
You "stole/froze" whatever you label it...Russian Assets and kicked them from Swift, which they return the favor by arguing that the ceasefire deal cant be done cause they don't like the style of pen you brought that day....
You decided to show the the world that you will turn a certain area of the Mediterranean into a French Plaza with beach front hotels, and may...maybe give the inhabitants vouchers to move away- one can say its a booming deal for them.
You decide to demonstrate to the world that on a tweet's notice you will change policy without official announcements and policy update for the rest of the world.
Then you decide...well I think that picture is becoming clear- Japan just bit the hand of Uncle Sam and said 'if you step any closer the treasuries get it'
So in all, the rally to ATH is literally exactly like 2009 and 2020, since there is literally nothing that has changed and everything above was equally going on, just change the dates and the people/places involved but exactly the same right.
Except for that weird number 0...0% which seemed to occur in 2009 and 2020- no coincidence there and todays 4.3% means absolutely nothing...just slight inflation, roughly 12-13k % increase...but its no issue.
So what can we surmise here....:
Well you were dropping for a good amount of time in 2009- ~504 days and in 2020 you basically turned the lights off and then on again...so that seems to fit with what just happened here right>>
you had 282 days of drop in 2022, which is 56% of 2009 and you literally made up a number of tariffs, then made up a lower number a month later and bingo-bango back up you go....
butttt...one of these things in pink just doesn't quite fit...so honestly it will be a delight to see how the see-saw theory works:
I call it a theory cause there is no proof on the chart that when the market goes up- yields go up, no case for it and not visible on the chart anywhere....So we should be good. Ergo....
As the market makes ATH and keeps charging up, the yields will go back down to 0% or so on the 3month and stay there cause that follows the see-saw theory. You don't keep money in the markets for too long as they rise, you rotate it into the treasuries cause you get a better stable return.
So...Trump and Bessent win...getting lower yields and a higher stock market- cause just look at the Technical Analysis everyone- there is only emotion in people saying Yields go up as the S&P goes up, its not cold hard logical facts right...only emotional people think stocks make yields go up..jeez
----
If you agree with the last bit there...you may need to check your local big city, over 2-3million inhabitants, to see how you are doing in these ATH markets....you may find that when treasuries are up....you arent doing so well on the street..
You can lie to a Tiger and say according to the charts you are more advanced than him and you will, according to the charts, beat him due to your superiority. He however lives in reality and wonders why you are talking to him and showing him a paper- so he offs you and walks away- feeling nothing cause you were the emotional one trying to use a chart to tell nature what it isn't. :)
be careful out there...cause V-bottom explosions need a 0 or close to 0% interest rate...and 4.3 isn't 0, so study an elliot wave guy and see if this isnt what is called the "B-wave" where you may settle back in the 400 range soon..and low 400 at that.
Trade active
review this....
Goes up into the dot.com era....down hard.....
Goes up into the '07 rise...down hard....
Stays down all up until 15 and then rise....hmmm...then down hard...
Goes up with 22....stays up in 23....stays up in 24....slightly pulls back in 25.....so???
IF we love TA in the trading world...what are the probabilities your yields go down when you go up and/or you go down as you market goes down....?
thoughts...comment them out and if the chart explains the opposite of what you say- there is a chance you are from Baltimore- cause a girl is illiterate and suing the public school system for graduations...yahhh for n ear 0% profeciencies...ATH to the moon baby :)
Disclaimer
The information and publications are not meant to be, and do not constitute, financial, investment, trading, or other types of advice or recommendations supplied or endorsed by TradingView. Read more in the Terms of Use.
Disclaimer
The information and publications are not meant to be, and do not constitute, financial, investment, trading, or other types of advice or recommendations supplied or endorsed by TradingView. Read more in the Terms of Use.