For Richard W. Schabacker, whom I consider the father of Technical Analysis in the West, rigorous technical analysis must combine the study of price and volume. Paradoxically, volume was the last piece of data I effectively integrated into my trading, due to the scarcity of practical information.
In this article, I will explore the classical view of using volume and then my personal approach, based on logic and accumulated experience.
Whether you are a novice or an expert in the markets, and whether or not you use volume to clarify your analyses, reading this article will enrich your perspective on this topic.
The Ichimoku indicator values displayed on the screen are personal variations, resulting from my research. I hope they are useful to you.
What is Volume?
In the context of financial markets, volume represents the number of shares, contracts, or lots traded in an asset over a specific period of time.
Volume reflects the intensity of market activity and is represented as a histogram just below the price chart.
"Volume is a relative matter; that is, when we speak of high volume, we refer to a transaction volume greater than what has prevailed for some time before."
— Richard W. Schabacker, Technical Analysis and Stock Market Profits
Classical View of Volume:
Generally, the main proponents inShannon proponents in this discipline see volume as useful for the following purposes:
1. Confirming the Strength of a Trend:
Volume should accompany the strength of a trend, and if volume is weak, it is likely that we can anticipate a reversal, as low volumes in a trend indicate a loss of interest among participants.
2. Analyzing Support and Resistance:
Most major proponents tend to view weak volume as a signal for potential reversals, while recommending validating breakouts of support and resistance with increased volume.
3. Analyzing Continuation or Exhaustion Patterns:
The classical approach suggests that before entering continuation or exhaustion patterns (such as accumulations, distributions, head and shoulders, double tops and bottoms, triangles, etc.), there should be a depletion of volume, followed by a breakout of the pattern with a significant increase in volume to confirm the presence of participant interest.
This approach is solid in theory, but in practice, it can lead to subjective interpretations and errors if not properly contextualized.
Personal View: May the Force Be with You
In my experience, volume should not be primarily interpreted by observing weakness, as this can lead to misreadings and premature market entries. Instead, I recommend focusing on detecting strength as the decisive factor. High volume reveals the massive entry of participants or large orders—whether from large investors or institutions—leaving a clear footprint in the market. These large orders, whether buy or sell, indicate real commitment and potential for sustained movements.
On Volume and Trend Analysis:
Why base a reversal on the weakness of a trend when the key is to identify the context and strength driving the change? A clearly weakened price action backed by low volumes can extend in the direction of the trend, draining our accounts if we base our entries on volume weakness. Whether trading with or against the trend, the turning point must be supported by robust volume. This spike in activity confirms the presence of large investors or institutions in action, translating into greater interest and liquidity.
As technical analysts, our goal is to capture fluctuations or trends, not to diagnose whether a trend is "healthy." Weakness is relevant information for detecting exhaustion, but it is strength, in the right context and with proper confirmation (through patterns), that will increase our success rate and improve our risk-reward ratio.
In Figure 1.1, we can see how volume spikes generally predict pauses or reversals in trends.
Figure 1.1
Tesla. Daily Chart

In Figure 1.2, we can observe how weak volume could indicate a loss of interest from participants (1 and 2), but it is an increase in volume combined with a Japanese candlestick pattern (3) that can confirm a likely effective entry.
Figure 1.2
BTC/USDT Daily Chart

On Volume in Support and Resistance Analysis:
As mentioned earlier, weakness is relevant information, but strength is essential to validate a trend reversal or continuation.
According to the classical approach, a breakout of support or resistance should be backed by a significant increase in volume. However, experience has taught me that the high volume detected during a breakout often represents common bull or bear traps, where buyers or sellers get trapped.
There are several reasons for this: supports and resistances are psychological zones that are constantly evolving, making it easy to confuse breakout volume with rejection volume. Additionally, during breakouts of significant supports or resistances, large institutions often manipulate or protect their positions by executing large buy or sell orders.
How can we avoid falling into bull or bear traps, or even use them to our advantage?
Personally, I recommend not seeking breakouts of supports and resistances based on volume. Price compressions around supports and resistances are more useful for this purpose, as they reveal the intent and dominance of buyers or sellers while offering a superior risk-reward ratio. High volumes generally indicate rejection, even if the zone appears to have been broken. Without prior compression—or accumulation or distribution—it is never advisable to chase breakouts.
In Figure 1.3, we can observe two phenomena in one: the breakout of a consolidation pattern and the breakout of a resistance ($110,000) following a price compression (3). Notice how buying forces intensely defended the $100,000 zone, as evidenced by volume spikes and large engulfing patterns that preceded them (1 and 2). The price compression at the $110,000 zone reveals the bullish intent to break the resistance in a context where buying strength is dominant.
On the other hand, in Figure 1.4, I show you what a bear trap looks like. Observe how what appears to be a confirmed breakout with volume at a defended support level ended up being a significant rejection by large investors or institutions (1).
At this point, I will make two clarifications:
The volume histogram is represented with colors on some investment platforms to facilitate the visual detection of patterns, but volumes themselves do not have color. Whether a volume is bullish or bearish does not depend on whether the accompanying candlestick is bullish or bearish, but rather on the real-time interpretation of the technical analyst and, above all, on the subsequent development of events. In the example of the false breakout in Figure 1.4, we observe a bullish rejection volume.
Another vital aspect is that supports in strong and healthy uptrends will generate more false breakouts than reliable ones, so I recommend taking more long entries. Additionally, during the euphoria and hope characteristic of a bullish market, short entries will be extremely risky.
In the articles “Bear and Bull Traps” and “Double Pressure: The Key to Successful Breakout Trading,” I describe these phenomena in detail.
Figure 1.3
BTC/USDT Daily Chart

Figure 1.4
BTC/USDT 4-Hour Chart

On Volume in Continuation or Exhaustion Patterns:
While it is often recommended to ensure a decrease in volume prior to the breakout of an exhaustion pattern, I recommend ensuring the detection of large volumes within the exhaustion pattern itself and confirming entries based on price compressions at the boundaries of the accumulation or distribution range.
Large volumes in continuation or exhaustion patterns indicate that many participants or strong institutions are partially or fully closing their buy or sell positions, which can lead to a correction. Even investors like Thomas Bulkowski have noted that the success rate increases in patterns where large volumes are present.
On the other hand, contrary to the classical approach, I recommend avoiding confirming entries based on pattern breakouts with large volume, as exhaustion and trend continuation patterns often generate strong bursts of volatility. In the best case, this may cause you to miss the trend, but in the worst case, it will expose you to entries with poor risk-reward ratios. Price compressions are a safer option for making entries and capitalizing on volatility bursts.
In Figure 1.5, you can observe the effectiveness of price compressions in the right context and how volume is a key factor in determining the presence of large investors.
Figure 1.5
BTC/USDT Daily Chart

Some Additional Examples:
An ABCD pattern offers excellent opportunities to take entries based on volume, always with confirmation from price action. In Figure 1.6, you will observe how I would effectively use bear traps (D), which are very common in strong uptrends.
Figure 1.6
BTC/USDT Daily Chart

Relevant Data on Volume:
Volume in Forex and CFDs
Both the Forex market (currencies) and CFDs (contracts for difference) operate in a decentralized, over-the-counter (OTC) manner, meaning there is no centralized exchange where all trading volume is recorded.
In Forex, the volume displayed on platforms does not represent the "true" total volume of the global market, but rather the flow of trades within the liquidity pool of the broker or its liquidity providers.
CFDs, being OTC derivatives offered by brokers, follow the same pattern: the visible volume is specific to the broker and its liquidity network, not the total volume of the underlying market. Brokers aggregate liquidity from multiple providers (such as banks or dark pools), but traders only see a fraction of this, which may not reflect the actual volume of the underlying asset (e.g., a CFD on stocks does not show the total volume of the stock exchange).
Volume in Centralized Stock Exchanges
Stock markets like the NYSE are centralized, meaning all transactions are executed and recorded on a single regulated exchange. This allows for consolidated, real-time reporting of the total volume of shares traded on that exchange. The volume reflects all executed trades, including the total number of shares bought and sold. Under strict regulation, the data is standardized, audited, and publicly accessible.
Volume in the Cryptocurrency Market
The cryptocurrency market is decentralized and fragmented, similar to Forex: transactions occur across multiple global exchanges (such as Binance or Coinbase) without a unified central record. This makes the total volume an aggregation of data reported by each platform, introducing inconsistencies and potential manipulations.
Personally, I recommend prioritizing data from Binance, as it consistently leads in spot and derivatives trading volume globally, representing a significant portion of the market (approximately 30-40% in recent aggregated metrics).
Volume and the S&P 500
Although the S&P 500 index, being a composite indicator and not a tradable asset itself, does not record transaction volume, a smart strategy for analyzing volume related to this index involves monitoring the trading volume of the SPY ETF (SPDR S&P 500 ETF Trust). This exchange-traded fund closely tracks the performance of the S&P 500 and attracts a high level of trading activity, providing a valuable metric for assessing market interest, liquidity, and potential volume patterns during bullish or bearish trends.
In Figures 1.7 and 1.8, you can see how S&P 500 readings can be cleverly combined with SPY volume data.
Figure 1.7
S&P 500 Daily Chart

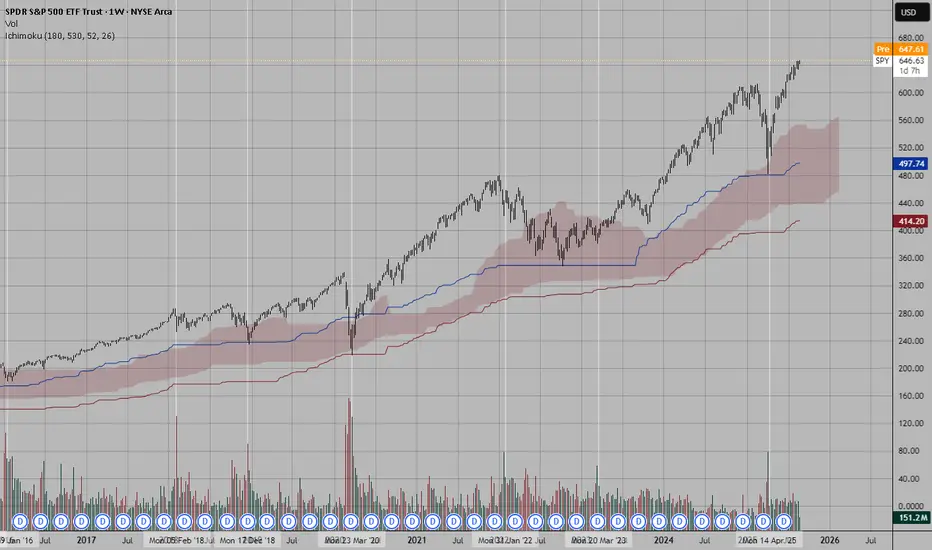
Figure 1.8
SPY Daily Chart

Final Note:
If you’d like to take a look at my analysis record, you can check out my profile in Spanish, where I transparently share well-defined market entries. Send your good vibes if you enjoyed this article, and may God bless you all.
In this article, I will explore the classical view of using volume and then my personal approach, based on logic and accumulated experience.
Whether you are a novice or an expert in the markets, and whether or not you use volume to clarify your analyses, reading this article will enrich your perspective on this topic.
The Ichimoku indicator values displayed on the screen are personal variations, resulting from my research. I hope they are useful to you.
What is Volume?
In the context of financial markets, volume represents the number of shares, contracts, or lots traded in an asset over a specific period of time.
Volume reflects the intensity of market activity and is represented as a histogram just below the price chart.
"Volume is a relative matter; that is, when we speak of high volume, we refer to a transaction volume greater than what has prevailed for some time before."
— Richard W. Schabacker, Technical Analysis and Stock Market Profits
Classical View of Volume:
Generally, the main proponents inShannon proponents in this discipline see volume as useful for the following purposes:
1. Confirming the Strength of a Trend:
Volume should accompany the strength of a trend, and if volume is weak, it is likely that we can anticipate a reversal, as low volumes in a trend indicate a loss of interest among participants.
2. Analyzing Support and Resistance:
Most major proponents tend to view weak volume as a signal for potential reversals, while recommending validating breakouts of support and resistance with increased volume.
3. Analyzing Continuation or Exhaustion Patterns:
The classical approach suggests that before entering continuation or exhaustion patterns (such as accumulations, distributions, head and shoulders, double tops and bottoms, triangles, etc.), there should be a depletion of volume, followed by a breakout of the pattern with a significant increase in volume to confirm the presence of participant interest.
This approach is solid in theory, but in practice, it can lead to subjective interpretations and errors if not properly contextualized.
Personal View: May the Force Be with You
In my experience, volume should not be primarily interpreted by observing weakness, as this can lead to misreadings and premature market entries. Instead, I recommend focusing on detecting strength as the decisive factor. High volume reveals the massive entry of participants or large orders—whether from large investors or institutions—leaving a clear footprint in the market. These large orders, whether buy or sell, indicate real commitment and potential for sustained movements.
On Volume and Trend Analysis:
Why base a reversal on the weakness of a trend when the key is to identify the context and strength driving the change? A clearly weakened price action backed by low volumes can extend in the direction of the trend, draining our accounts if we base our entries on volume weakness. Whether trading with or against the trend, the turning point must be supported by robust volume. This spike in activity confirms the presence of large investors or institutions in action, translating into greater interest and liquidity.
As technical analysts, our goal is to capture fluctuations or trends, not to diagnose whether a trend is "healthy." Weakness is relevant information for detecting exhaustion, but it is strength, in the right context and with proper confirmation (through patterns), that will increase our success rate and improve our risk-reward ratio.
In Figure 1.1, we can see how volume spikes generally predict pauses or reversals in trends.
Figure 1.1
Tesla. Daily Chart
In Figure 1.2, we can observe how weak volume could indicate a loss of interest from participants (1 and 2), but it is an increase in volume combined with a Japanese candlestick pattern (3) that can confirm a likely effective entry.
Figure 1.2
BTC/USDT Daily Chart
On Volume in Support and Resistance Analysis:
As mentioned earlier, weakness is relevant information, but strength is essential to validate a trend reversal or continuation.
According to the classical approach, a breakout of support or resistance should be backed by a significant increase in volume. However, experience has taught me that the high volume detected during a breakout often represents common bull or bear traps, where buyers or sellers get trapped.
There are several reasons for this: supports and resistances are psychological zones that are constantly evolving, making it easy to confuse breakout volume with rejection volume. Additionally, during breakouts of significant supports or resistances, large institutions often manipulate or protect their positions by executing large buy or sell orders.
How can we avoid falling into bull or bear traps, or even use them to our advantage?
Personally, I recommend not seeking breakouts of supports and resistances based on volume. Price compressions around supports and resistances are more useful for this purpose, as they reveal the intent and dominance of buyers or sellers while offering a superior risk-reward ratio. High volumes generally indicate rejection, even if the zone appears to have been broken. Without prior compression—or accumulation or distribution—it is never advisable to chase breakouts.
In Figure 1.3, we can observe two phenomena in one: the breakout of a consolidation pattern and the breakout of a resistance ($110,000) following a price compression (3). Notice how buying forces intensely defended the $100,000 zone, as evidenced by volume spikes and large engulfing patterns that preceded them (1 and 2). The price compression at the $110,000 zone reveals the bullish intent to break the resistance in a context where buying strength is dominant.
On the other hand, in Figure 1.4, I show you what a bear trap looks like. Observe how what appears to be a confirmed breakout with volume at a defended support level ended up being a significant rejection by large investors or institutions (1).
At this point, I will make two clarifications:
The volume histogram is represented with colors on some investment platforms to facilitate the visual detection of patterns, but volumes themselves do not have color. Whether a volume is bullish or bearish does not depend on whether the accompanying candlestick is bullish or bearish, but rather on the real-time interpretation of the technical analyst and, above all, on the subsequent development of events. In the example of the false breakout in Figure 1.4, we observe a bullish rejection volume.
Another vital aspect is that supports in strong and healthy uptrends will generate more false breakouts than reliable ones, so I recommend taking more long entries. Additionally, during the euphoria and hope characteristic of a bullish market, short entries will be extremely risky.
In the articles “Bear and Bull Traps” and “Double Pressure: The Key to Successful Breakout Trading,” I describe these phenomena in detail.
Figure 1.3
BTC/USDT Daily Chart
Figure 1.4
BTC/USDT 4-Hour Chart
On Volume in Continuation or Exhaustion Patterns:
While it is often recommended to ensure a decrease in volume prior to the breakout of an exhaustion pattern, I recommend ensuring the detection of large volumes within the exhaustion pattern itself and confirming entries based on price compressions at the boundaries of the accumulation or distribution range.
Large volumes in continuation or exhaustion patterns indicate that many participants or strong institutions are partially or fully closing their buy or sell positions, which can lead to a correction. Even investors like Thomas Bulkowski have noted that the success rate increases in patterns where large volumes are present.
On the other hand, contrary to the classical approach, I recommend avoiding confirming entries based on pattern breakouts with large volume, as exhaustion and trend continuation patterns often generate strong bursts of volatility. In the best case, this may cause you to miss the trend, but in the worst case, it will expose you to entries with poor risk-reward ratios. Price compressions are a safer option for making entries and capitalizing on volatility bursts.
In Figure 1.5, you can observe the effectiveness of price compressions in the right context and how volume is a key factor in determining the presence of large investors.
Figure 1.5
BTC/USDT Daily Chart
Some Additional Examples:
An ABCD pattern offers excellent opportunities to take entries based on volume, always with confirmation from price action. In Figure 1.6, you will observe how I would effectively use bear traps (D), which are very common in strong uptrends.
Figure 1.6
BTC/USDT Daily Chart
Relevant Data on Volume:
Volume in Forex and CFDs
Both the Forex market (currencies) and CFDs (contracts for difference) operate in a decentralized, over-the-counter (OTC) manner, meaning there is no centralized exchange where all trading volume is recorded.
In Forex, the volume displayed on platforms does not represent the "true" total volume of the global market, but rather the flow of trades within the liquidity pool of the broker or its liquidity providers.
CFDs, being OTC derivatives offered by brokers, follow the same pattern: the visible volume is specific to the broker and its liquidity network, not the total volume of the underlying market. Brokers aggregate liquidity from multiple providers (such as banks or dark pools), but traders only see a fraction of this, which may not reflect the actual volume of the underlying asset (e.g., a CFD on stocks does not show the total volume of the stock exchange).
Volume in Centralized Stock Exchanges
Stock markets like the NYSE are centralized, meaning all transactions are executed and recorded on a single regulated exchange. This allows for consolidated, real-time reporting of the total volume of shares traded on that exchange. The volume reflects all executed trades, including the total number of shares bought and sold. Under strict regulation, the data is standardized, audited, and publicly accessible.
Volume in the Cryptocurrency Market
The cryptocurrency market is decentralized and fragmented, similar to Forex: transactions occur across multiple global exchanges (such as Binance or Coinbase) without a unified central record. This makes the total volume an aggregation of data reported by each platform, introducing inconsistencies and potential manipulations.
Personally, I recommend prioritizing data from Binance, as it consistently leads in spot and derivatives trading volume globally, representing a significant portion of the market (approximately 30-40% in recent aggregated metrics).
Volume and the S&P 500
Although the S&P 500 index, being a composite indicator and not a tradable asset itself, does not record transaction volume, a smart strategy for analyzing volume related to this index involves monitoring the trading volume of the SPY ETF (SPDR S&P 500 ETF Trust). This exchange-traded fund closely tracks the performance of the S&P 500 and attracts a high level of trading activity, providing a valuable metric for assessing market interest, liquidity, and potential volume patterns during bullish or bearish trends.
In Figures 1.7 and 1.8, you can see how S&P 500 readings can be cleverly combined with SPY volume data.
Figure 1.7
S&P 500 Daily Chart
Figure 1.8
SPY Daily Chart
Final Note:
If you’d like to take a look at my analysis record, you can check out my profile in Spanish, where I transparently share well-defined market entries. Send your good vibes if you enjoyed this article, and may God bless you all.
Disclaimer
The information and publications are not meant to be, and do not constitute, financial, investment, trading, or other types of advice or recommendations supplied or endorsed by TradingView. Read more in the Terms of Use.
Disclaimer
The information and publications are not meant to be, and do not constitute, financial, investment, trading, or other types of advice or recommendations supplied or endorsed by TradingView. Read more in the Terms of Use.