SPY – Bullish Recovery Faces Key Resistance 🚀
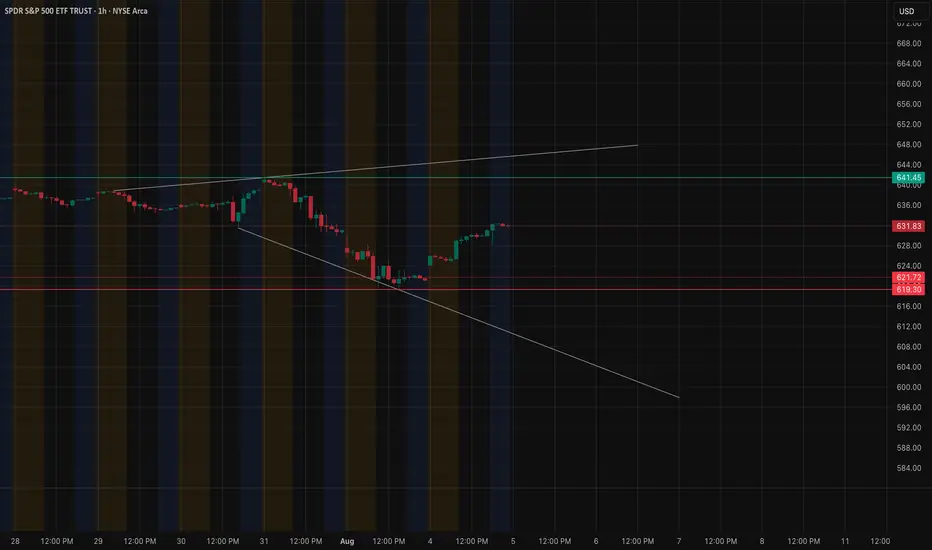
1H Technical Analysis & GEX Overview SPY has staged a notable recovery from the recent pullback, breaking out of the descending channel and now pressing toward a key resistance cluster near 631–633. This zone aligns with the Highest Positive NETGEX and a 2nd Call Wall, making it a pivotal area to watch for continuation or rejection.
* Support Levels:
* 621–622 → Key structure support and HVL zone (08/04). Losing this could reopen downside toward 615 and 610.
* 615 / 610 → Next downside targets aligned with 2nd & 3rd Put Walls.
* Resistance Levels:
* 631–633 → GEX resistance & 2nd Call Wall; breakout here could fuel a run toward 640+.
GEX Insights
* Positive GEX builds above 628, signaling potential dealer hedging that could limit extreme upside but support gradual climbs.
* Negative GEX dominates under 621, suggesting increased downside momentum risk if price breaks support.
* Put positioning remains elevated at 81.3%, hinting at cautious sentiment but also squeeze potential if shorts get trapped.
Trade Scenarios
* Bullish Case:
* Break and close above 633 opens path to 640+.
* Options: Consider short-term Call spreads targeting 640 if breakout confirmed with strong volume.
* Bearish Case:
* Rejection from 631–633 and break below 621 could send SPY toward 615/610.
* Options: Put spreads targeting 615 with tight risk management.
15-Minute View (Intraday)
* Momentum is holding strong above VWAP, but intraday resistance at 631 is visible.
* A clear BOS above 631 with volume could trigger fast upside continuation intraday.
* Best scalp entries: pullbacks to 628–629 if defended as support.
Outlook Bias leans cautiously bullish into the 631–633 test. Watch for confirmation on volume before chasing upside. If rejection occurs, expect choppy pullback toward 625–622 for a potential bounce.
Disclaimer: This analysis is for educational purposes only and not financial advice. Always do your own research and manage your risk before trading.
Disclaimer
The information and publications are not meant to be, and do not constitute, financial, investment, trading, or other types of advice or recommendations supplied or endorsed by TradingView. Read more in the Terms of Use.
Disclaimer
The information and publications are not meant to be, and do not constitute, financial, investment, trading, or other types of advice or recommendations supplied or endorsed by TradingView. Read more in the Terms of Use.