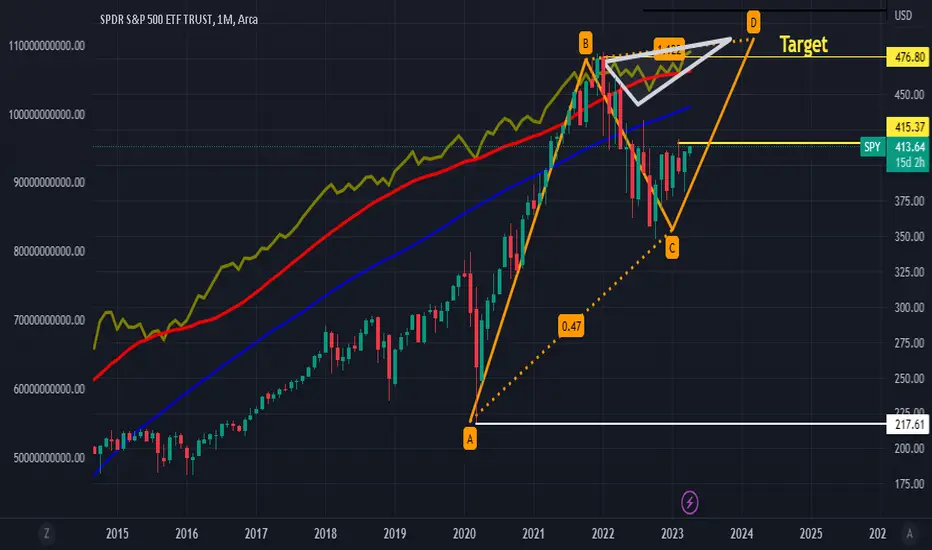
1st and foremost, i'm only doing this because I hate to see good people loose money. PRICE ACTION MEANS NOTHING, Nothing moves but the money. Please understand this... The AD and Money flow are Ascending... There is a bullish abcd pattern which correlates to the ABCD pattern on the  SPX go against this at your own will
Notice the AD is in an ascending triangle pattern targeting 475 which is a retest of previous highs..
dont ask for updates, No I DONT HAVE A DISCORD, NO I DONT WANT YOUR MONEY, I DONT HAVE A WEBSITE... CHEERS.
Notice the AD is in an ascending triangle pattern targeting
dont ask for updates, No I DONT HAVE A DISCORD, NO I DONT WANT YOUR MONEY, I DONT HAVE A WEBSITE... CHEERS.
Note
I'm going to revisit this potential bullish cypher pattern after Note
Note
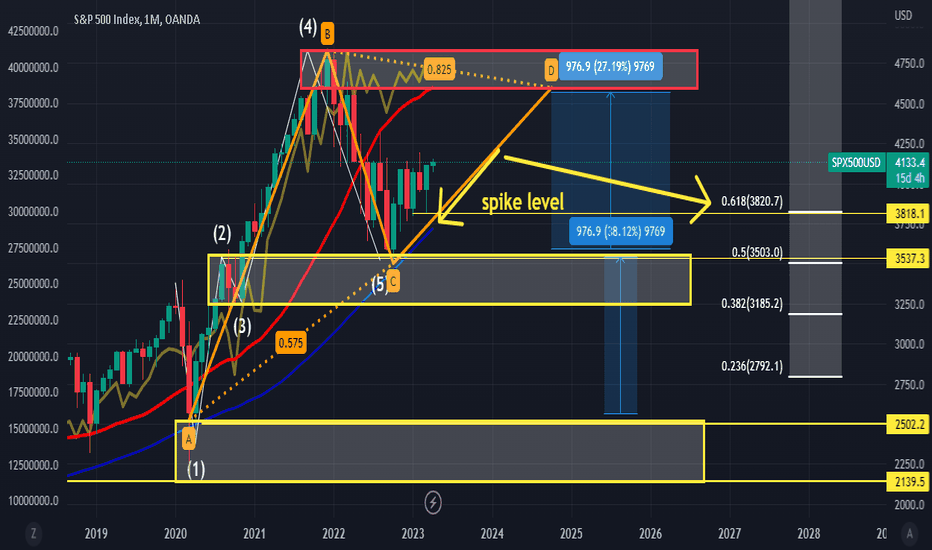
AD is set to cross over a spike level on the monthly chart on the sp500 futures... If this occurs, then you can't rule out the SP500 futures & I stay in my own lane, I rarely look at other chartist. I only look at the Money Flow and the AD...
Note
Price Action + Chikou Spann Double bottom= Buy signal.. seen yesterday..handle needs depth. Monitoring two handles. previous resistances needs to hold as support cup/handle set up... Likely short squeeze to get price action over $415... looking for this to carry over the new few trading sessions
Note
both bullish/bearish patterns continue to higher time frames until there is an invalidation of said trend. above chart is 1hr time frame, this is the 2hr time frame which looks more evident Note
now the cup/handle on the spy chart is more than a cup/handle... Note
you have inverse head and shoulders set up... this is a bullish continuation pattern. Which means, said trend will continue to higher time frames. so If it occurs on the 2hr, then its likely to occur on the 3hr/4hr/daily/weekly/monthly until said trend is invalidated. this is why you have to trade between multiple time frames..Note
why 415 is important Note
above chart is the 3hr ... I will continue to monitor til there is an invalidation... 415 must be taken out firstNote
now look at the 3hr, you have a bull flag in a box consolidation Note
on the sp500 futures... cup/handle breakout is key... that is all for nowNote
secret patterns are hidden in the AD/Money Flow Note
xlf- Target 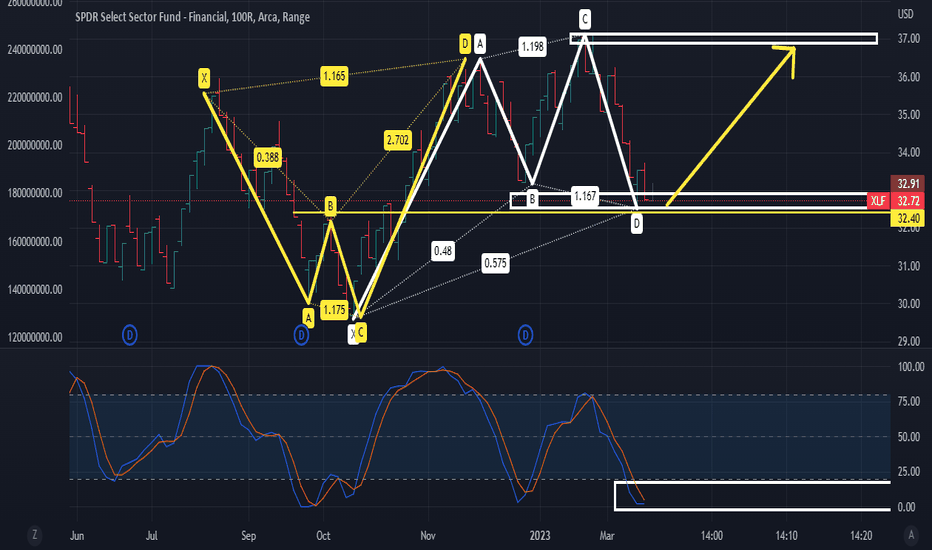
Note
The Faz Short trade $$$ (study the set up) 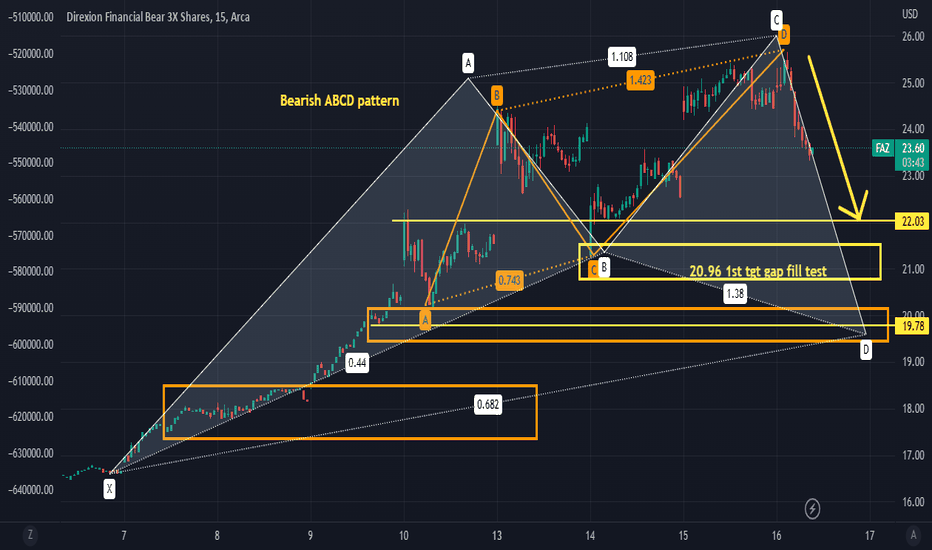
Note
415 Hit 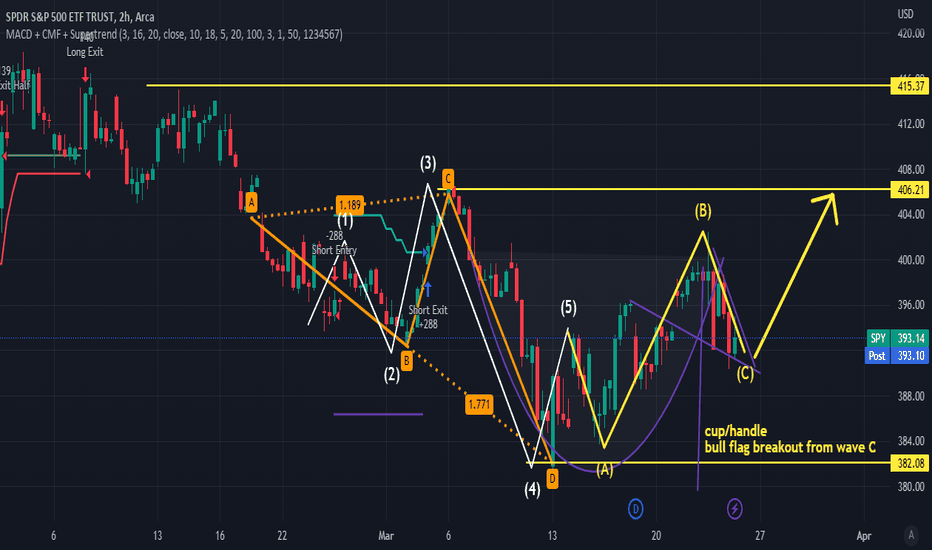
Note
3hr box consolidation/bull flag on the sp500 futures broke out.. look for 4250 on the spx futuresNote
I have not updated the chart. JPM heading to 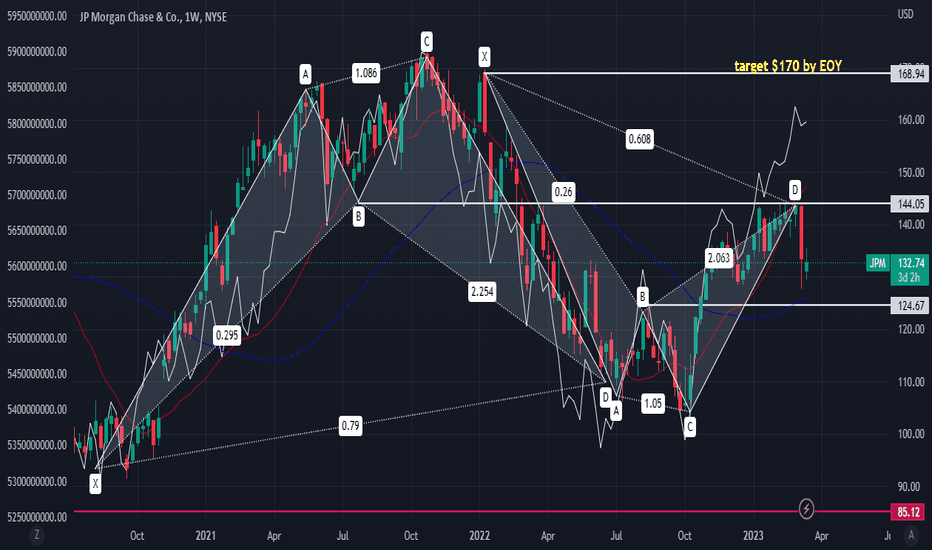
Note
Note
buy signals flashing on Note
The AD is showing me the set up. Money Flow show buy signals before price action is determined. Chikou Spann + Price Action = buy signal on
Note
Note
retesting the handle Note
and if you look closer you can see an inverse head and shoulders pattern formingNote
wave 4 is the left shoulder of the inverse head and shoulders pattern on $labu..Note
buy the B leg of the ABCD pattern on Note
and 4hr cup/handle on spy is forming Note
4hr cup/handle retest of $415 gives breakout... made the chart live for you to track... added some calls 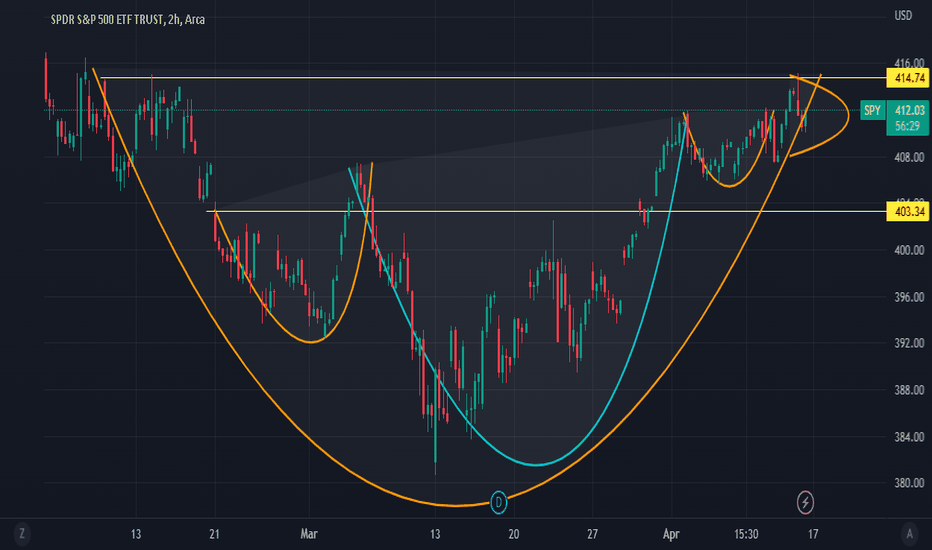
Note
click on the chart above, takes you directly to the linkNote
cracking the code on labu, buy above b leg of the bearish cypher pattern. I hope its all making sense now Note
they dont want to show you this Note
Note
Note
if you look at the Stoch RSI on the 4hr, we're still not in overbought territory. We'll get the answers Monday/Tuesday next week. I'm prepared for $430.. have a good weekend folksNote
This was my Apple Trade, its getting close to my Target of $171... since Apple is a behemoth of a company and counts for 7.08% of the Spy etf as of April 13, 2023 , its important to show this chart.. 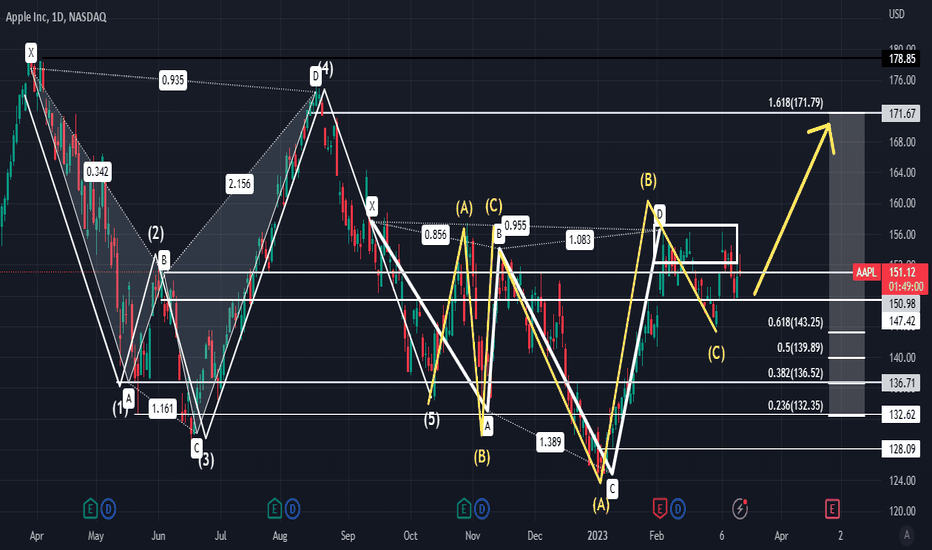
Note
Chart was Created March 14th, 2023.. There needs to be another Catalyst to get us above Wave 4/D Leg... Now remember what I said about bullish continuation patterns, they will proceed to the higher time frames until there's an invalidation of said trend. This cup/handle pattern, should carry over to the next higher time frame which is the Daily chartNote
4hr chart of cup/handle Note
you have to train your eyes... find the Supply zone (the last sold off zone)look at the stoch rsi on the Daily chart, and you'll see we're not in overbought territory
Note
Note
look for a base, you see how its basing ? Note
IMHO AAPL will continue to lead the SP500 higher, take a look at the weekly chart... $171.50 breakout, takes out the weekly resistances on APPL.. also the Stoch rsi is ascending on the weekly chart... Note
now go to the Monthly Chart of Appl, you'll start to see the bull flag set up and the low stoch rsi Note
MSFT- Cup/Handle set up.. but do you see the bull flag Note
MSFT Bull Flag Set Up... buy the Dips. In addition to this.. MSFT & Appl make up just over 13% of the sp500 etf SPY...and both are prime for breakout..Note
look beyond what your eyes can see. Things are hidden right in front of you... A cup/handle, within a larger cup and handle basing Note
looking what the AD is showing on msft Note
bull flag by the AD on the sp500 futures... You dont have to see it or agree with it... Note
Note
now w/out the wave count Note
prev. resistances acting as support... needs to close above D leg Note
w/ pitchfork Note
click this live chart notice how wave 3 is now acting as support... we had two bounces off of wave 3 which was above 406.50
Note
Note
Monster Day in LABU (3x biotech etf) I hope some of yall got in the LABU Trade I posted it last week near market close. I haven't updated the chart... I mentioned the 41% gains as its headed to 7.15.. This chart is the higher time frame... I haven't updated it all ... This is how I know the markets aren't tanking.. dont be mislead by some of these Chartist on Trading View. I honestly question some of their motives. I Just follow the Money and stay in my own lane... Note
XBI, look for a retest of the Supply Zone (buy the dips) Note
AD is showing me a Bull Flag on XBI Daily Chart Note
A breakout above this resistances level puts XBI over 90+ and will see it retest the Supply Zone 90+ Note
The AD is showing an ascending triangle on the Daily Chart of Amazon.. i'll break this down here, but also create a separate live chart for those interested in the trade. Im posting multiple under the SPY because these charts are essential for the rally to 430 then 475. Block out the Naysayers Note
Amazon wants to retest the supply zone $190 price target by the AD which is in an ascending triangle pattern Note
amzn, first supply zone to be tested is 150... the AD is ascending there as well. There is also a stealth inverse head and shoulders pattern which is bullish...they hid this in plain sight and have been in the accumulation phase
Note
correction lets worry about 125 for amzn first Note
and this my friend is how you forecast w/ money flow... this whole inverse head and shoulders movement is the head to the larger inverse head and shoulders pattern
Note
My oil analysis for a retest of all time highs... created in the 60's, we will be seeing 100 a barrel soon 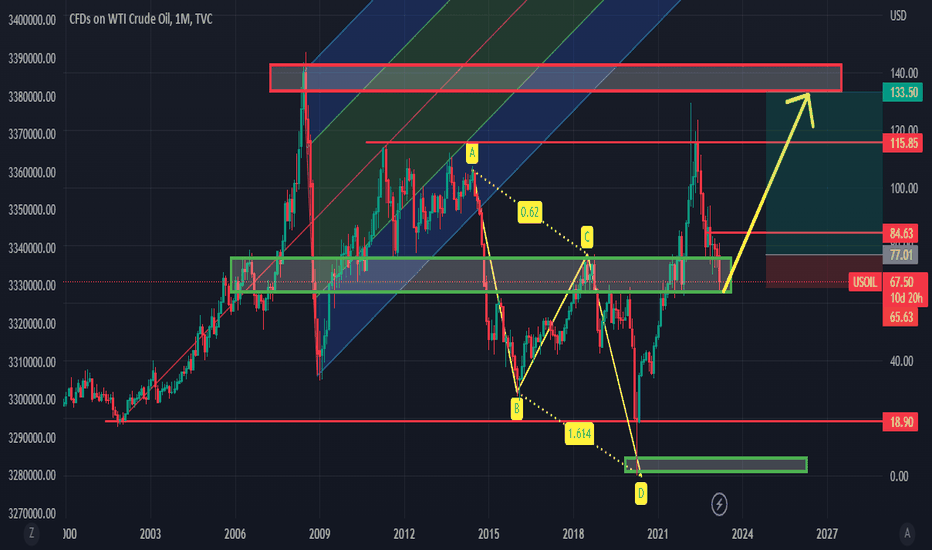
Note
this could be the bullish continuation of a huge momentum in oil... this is a bullish cypher pattern by the AD... which could lead to higher time frames, meaning higher breakouts... in the price of oil.. monitor gush/drip.. Note
looking for 4200 today w/ a confirm AD spike of th 1hr time frame of spx500usd... if we get the AD/50 ema cross over Note
spy up $2.13 from this call at 3:20 yesterday.. and spy could run to 420 by eow easily... Note
The NVDA Trade set up 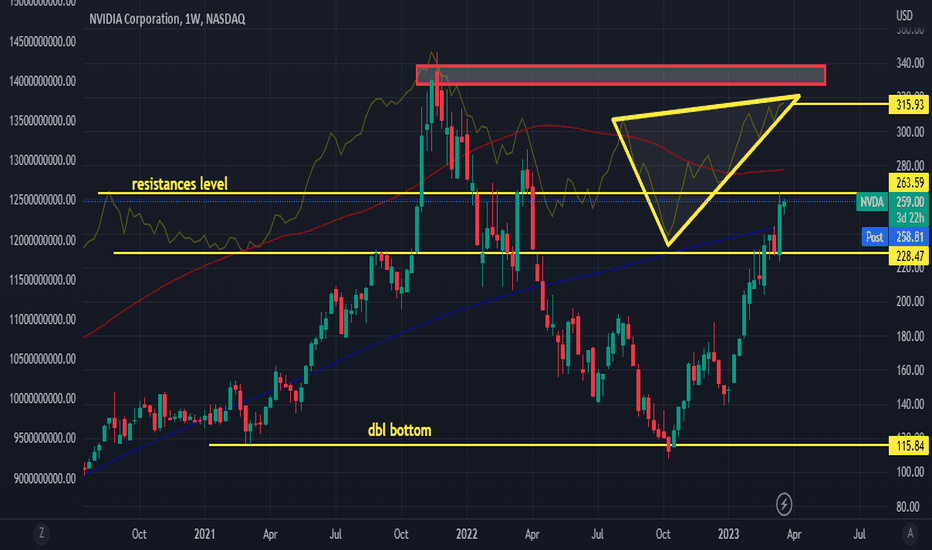
Note
The NVDA Chart is live, click the chart aboveNote
AD crossed over the 1hr moving avg on the sp500 futures Note
Note
will get a retrace back to 412 if the 18 ema doesnt hold this cup/handle breakout set up. Note
I didnt think the handle would form, looking for a bullish cross over by the moving avg to the spike level Note
bitcoin is oversold on the 30min time frame, im looking for 30k to hold I will break this down even more Note
however its not oversold on the 1hr time frame, which also has a cup/handle pattern forming... these patterns will continue until theres an invalidation of said pattern.. the 1hr time frame will also offer a bigger spike once complete. Note
a breach of 29600 invalidates the bullish momentum for the 1hr trade set up..Note
B leg resistances of the sp500 futures is now support. This becomes invalidated below 4087, it would have to close below this to invalidate the move. In fact, I would say we've broken out above trendline resistances but have not closed above D leg resistances.. Im looking for this to happen this week Note
can see we're above trendline resistances here Note
Take a look at the AD here. This is a bearish Cypher pattern, Bears have attempted to take it below the 50 day moving avg. However, look at how B leg previous resistances is now acting as support, which is holding up near the 50 day moving avg. for the sp500 futures.. The money flow is strong here... Bears would have to dump Billions to invalidate this move and push price action back to Note
with Fibs Note
im a buyer of this futures dip tonight Note
looking for a retest of x legNote
I showed this chart yesterday, if you scroll up above.. look at how prev. resistances is acting as support and bounce off the .618 fib level. I haven't updated the chart at all. this is the 15min time frame Note
from yesterday Note
30min view. each time frame has a spike level in which key moving avg will cross through.. take a look at the 30min chart Note
that moving day moving avg will cross over the .50 fib level, then the .618 fib level and price action will end up retesting 415+ ... put that in the back of your mind and lets go green Note
higher time frames lead to higher spikesNote
1hr time frame is very bullish Note
1hr bullish chart Note
keep this bearish cypher pattern in the back of your mind Note
at 4300, could be a short level... could catch a lot of folks off guard (im forecasting this for now, not a specific trade set up... but something that has to be respected at 4300 when we get there)Note
see my live Amzn chart, and other charts on amzn.. 105 is breakout level. and on the 5min chart we have the stoch rsi below the cloud in oversold territory, looking for it to run up some more to at least 120-125 over the next month ... Note
prev. resistances now support Note
the amzn chart is live 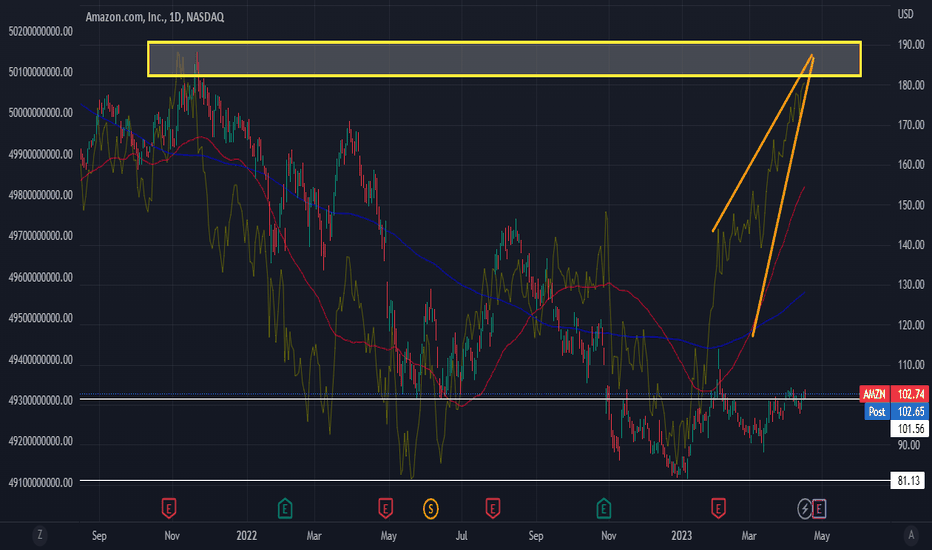
Note
buy zones Note
Note
future forecast Note
430 target for Goldman Sachs , this is actually a bull flag in disguise Note
Keep an eye out for AMD Note
adding TSLA this morning, its still in the handle on the weekly chart... and buying the dip on SPY this morning .. take a look at the live tesla weekly chart 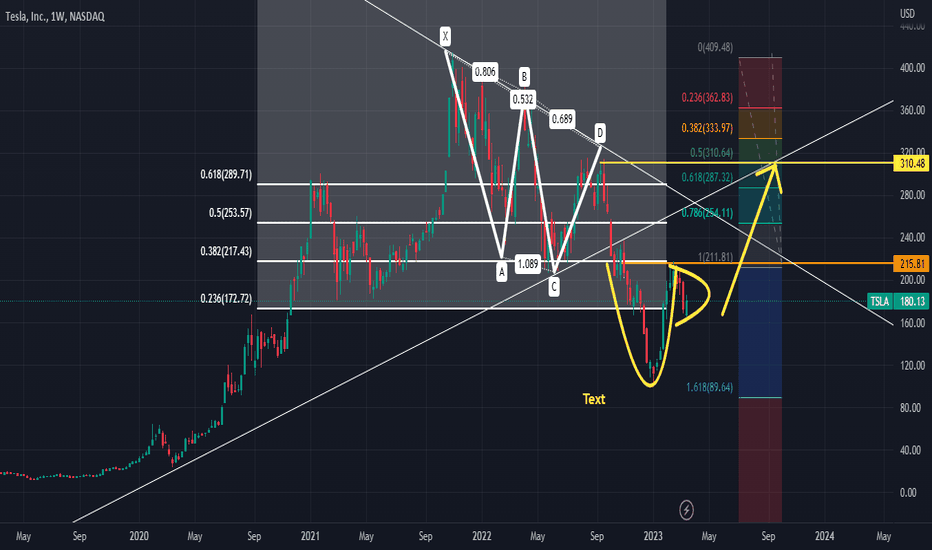
Note
why im buying tesla dip this morning Note
Im trusting the AD/Money Flow I got bullish divergence.. not for the weak, if you scared sit this out on the sidelines and buy higher Note
the 3 month chart is extremely bullish Note
price action needs to close above wave 4 (412) dont short this w/out looking at the chart 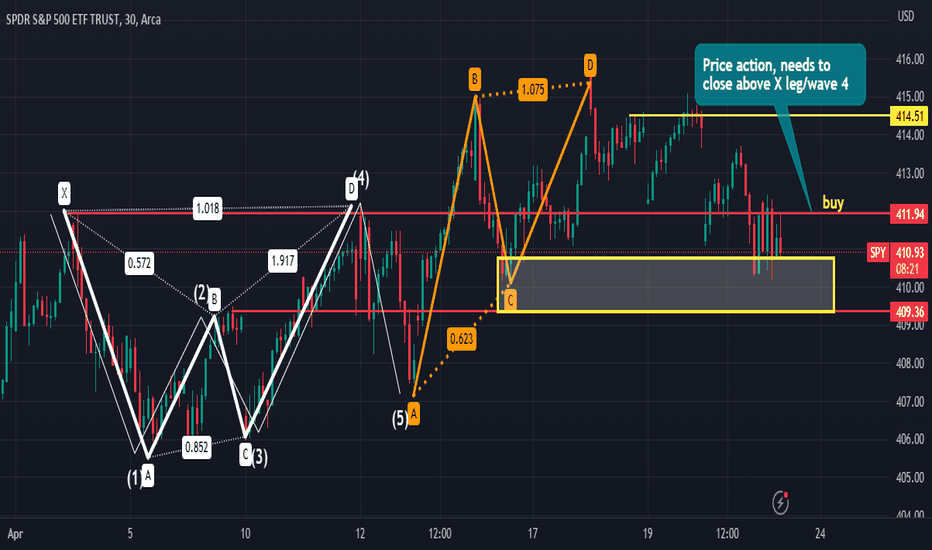
Note
Note
going for it going for it Note
All in an upward channel Related publications
Disclaimer
The information and publications are not meant to be, and do not constitute, financial, investment, trading, or other types of advice or recommendations supplied or endorsed by TradingView. Read more in the Terms of Use.
Related publications
Disclaimer
The information and publications are not meant to be, and do not constitute, financial, investment, trading, or other types of advice or recommendations supplied or endorsed by TradingView. Read more in the Terms of Use.