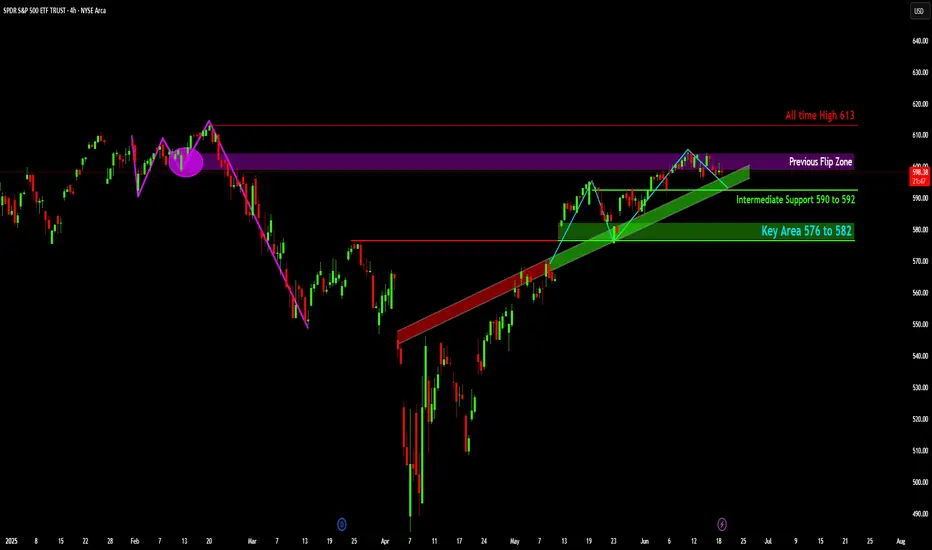
- The price action of SPY, shows a significant decline from early February highs, followed by a strong recovery and an established uptrend from mid-April.
- Price is currently testing the "Previous Flip Zone" (indicated by the purple shaded area), a level that previously acted as support before the market's sharp decline and has since been retested as resistance.
- The "All time High 613" is marked as a major overhead resistance level, representing the peak achieved before the February drawdown.
- An "Intermediate Support" zone is identified between 590 and 592, coinciding with the upward-sloping green trendline that has supported the recent rally.
- A "Key Area" of support is highlighted further down between 576 and 582, indicating a more substantial demand zone should the intermediate support be breached.
Disclaimer:
The information provided in this chart is for educational and informational purposes only and should not be considered as investment advice. Trading and investing involve substantial risk and are not suitable for every investor. You should carefully consider your financial situation and consult with a financial advisor before making any investment decisions. The creator of this chart does not guarantee any specific outcome or profit and is not responsible for any losses incurred as a result of using this information. Past performance is not indicative of future results. Use this information at your own risk. This chart has been created for my own improvement in Trading and Investment Analysis. Please do your own analysis before any investments.
Disclaimer
The information and publications are not meant to be, and do not constitute, financial, investment, trading, or other types of advice or recommendations supplied or endorsed by TradingView. Read more in the Terms of Use.
Disclaimer
The information and publications are not meant to be, and do not constitute, financial, investment, trading, or other types of advice or recommendations supplied or endorsed by TradingView. Read more in the Terms of Use.