SPY Slips into Deep Negative Gamma — $629.73 Pivot Under Siege
🔍 GEX & Options Flow Insight (1st Image Analysis)
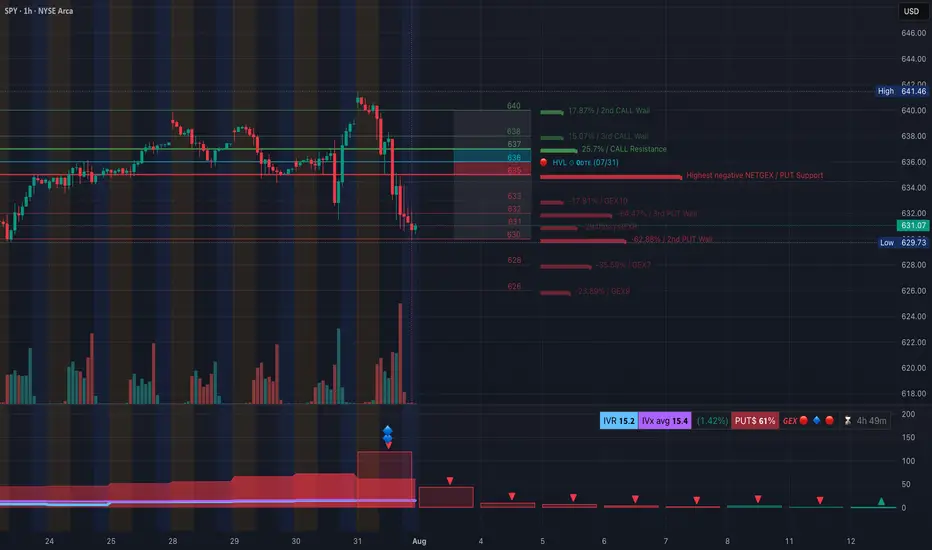
SPY has rolled over sharply from the $641 highs, slicing through multiple support zones and now probing the $629–$631 gamma pivot. The GEX structure is decisively negative, signaling elevated downside risk if this key level fails.
* Call Walls & Resistance:
* 📍 $636.39 → 1st resistance (Call resistance zone)
* 📍 $639.48–$640.28 → 2nd Call Wall cluster
* 📍 $641.46 → Highest call wall / gamma resistance
* Put Walls & Support Zones:
* 🛡️ $631.07 → Current key gamma pivot
* 🚨 $629.73 → Highest negative NET GEX / critical floor
* 📉 Break below $629 risks a flush to $626–$622
* Volatility Insight:
* IVR 15.2, IVx Avg 15.4 → Low realized volatility despite price slide
* Put flow 61% → Heavily bearish
* GEX sentiment: 🔴🔴🔴 = Strong negative gamma — market likely to see amplified moves in current direction
✅ Option Trading Suggestion:
Bias: Bearish unless reclaiming $636+ Strategy: Bear put spread or put fly
* Entry Idea: Buy 630P / Sell 625P (Aug 2 or Aug 9 expiry)
* Invalidation: Close above $636
* Target: $626 → $622
Why this works: SPY is pinned near a major negative gamma inflection. Below $629.73, dealer hedging could accelerate selling pressure toward $622.
🧠 Technical Analysis (1H Chart) (2nd Image Analysis)

Market Structure & SMC:
* 🟥 CHoCH confirmed after rejection at $641
* ❌ Broke short-term BOS levels in the $637–$636 zone
* Currently trading in a downward-sloping structure with multiple failed bounces
Trendline Dynamics:
* Clean descending channel from July 30 highs
* Lower bound projection points to $626–$622 support
SMC Zones:
* 🟩 Demand Zone: $629–$626 → Short-term bounce risk here
* 🟥 Supply Zone (Purple Box): $636–$639 → Heavy overhead resistance
🔄 Price Action & Key Levels
* Support:
* ✅ $631.07 → Current gamma pivot
* 🚨 $629.73 → Key breakdown trigger
* 📉 $626 → Lower demand
* 📉 $622 → Deeper downside target
* Resistance:
* 🚩 $636.39 → First reclaim level for relief
* 🚩 $639.48 → Mid supply
* 🚩 $641.46 → Full reversal point
🧭 Scalping / Intraday Trade Setup
🟥 Bearish Setup (Preferred):
* Entry: Breakdown under $629.73
* Target 1: $626
* Target 2: $622
* Stop: Above $632
🟩 Bullish Reversal Setup:
* Entry: Reclaim of $636.39 with strong volume
* Target 1: $639.48
* Target 2: $641.46
* Stop: Below $634
🔁 Summary Thoughts
* SPY is in a clean downtrend inside a negative gamma regime.
* $629.73 is the critical make-or-break line — holding it could trigger a small bounce, breaking it could unleash another wave of selling toward $622.
* Options flow is heavily bearish, aligning with technical weakness.
🚨 Disclaimer:
This analysis is for educational purposes only and does not constitute financial advice. Always do your own research and manage your risk accordingly.
🔍 GEX & Options Flow Insight (1st Image Analysis)
SPY has rolled over sharply from the $641 highs, slicing through multiple support zones and now probing the $629–$631 gamma pivot. The GEX structure is decisively negative, signaling elevated downside risk if this key level fails.
* Call Walls & Resistance:
* 📍 $636.39 → 1st resistance (Call resistance zone)
* 📍 $639.48–$640.28 → 2nd Call Wall cluster
* 📍 $641.46 → Highest call wall / gamma resistance
* Put Walls & Support Zones:
* 🛡️ $631.07 → Current key gamma pivot
* 🚨 $629.73 → Highest negative NET GEX / critical floor
* 📉 Break below $629 risks a flush to $626–$622
* Volatility Insight:
* IVR 15.2, IVx Avg 15.4 → Low realized volatility despite price slide
* Put flow 61% → Heavily bearish
* GEX sentiment: 🔴🔴🔴 = Strong negative gamma — market likely to see amplified moves in current direction
✅ Option Trading Suggestion:
Bias: Bearish unless reclaiming $636+ Strategy: Bear put spread or put fly
* Entry Idea: Buy 630P / Sell 625P (Aug 2 or Aug 9 expiry)
* Invalidation: Close above $636
* Target: $626 → $622
Why this works: SPY is pinned near a major negative gamma inflection. Below $629.73, dealer hedging could accelerate selling pressure toward $622.
🧠 Technical Analysis (1H Chart) (2nd Image Analysis)
Market Structure & SMC:
* 🟥 CHoCH confirmed after rejection at $641
* ❌ Broke short-term BOS levels in the $637–$636 zone
* Currently trading in a downward-sloping structure with multiple failed bounces
Trendline Dynamics:
* Clean descending channel from July 30 highs
* Lower bound projection points to $626–$622 support
SMC Zones:
* 🟩 Demand Zone: $629–$626 → Short-term bounce risk here
* 🟥 Supply Zone (Purple Box): $636–$639 → Heavy overhead resistance
🔄 Price Action & Key Levels
* Support:
* ✅ $631.07 → Current gamma pivot
* 🚨 $629.73 → Key breakdown trigger
* 📉 $626 → Lower demand
* 📉 $622 → Deeper downside target
* Resistance:
* 🚩 $636.39 → First reclaim level for relief
* 🚩 $639.48 → Mid supply
* 🚩 $641.46 → Full reversal point
🧭 Scalping / Intraday Trade Setup
🟥 Bearish Setup (Preferred):
* Entry: Breakdown under $629.73
* Target 1: $626
* Target 2: $622
* Stop: Above $632
🟩 Bullish Reversal Setup:
* Entry: Reclaim of $636.39 with strong volume
* Target 1: $639.48
* Target 2: $641.46
* Stop: Below $634
🔁 Summary Thoughts
* SPY is in a clean downtrend inside a negative gamma regime.
* $629.73 is the critical make-or-break line — holding it could trigger a small bounce, breaking it could unleash another wave of selling toward $622.
* Options flow is heavily bearish, aligning with technical weakness.
🚨 Disclaimer:
This analysis is for educational purposes only and does not constitute financial advice. Always do your own research and manage your risk accordingly.
Disclaimer
The information and publications are not meant to be, and do not constitute, financial, investment, trading, or other types of advice or recommendations supplied or endorsed by TradingView. Read more in the Terms of Use.
Disclaimer
The information and publications are not meant to be, and do not constitute, financial, investment, trading, or other types of advice or recommendations supplied or endorsed by TradingView. Read more in the Terms of Use.