4H Chart (Short-Term View)
Trend: Ongoing bullish momentum with dominant green candles.
Key Breakout: Strong breakout above the $594–$596 resistance zone, which now acts as support.
Volume Profile (VPVR): A low-volume area between $595 and $610 suggests potential for a swift move higher.
Indicators: The Ichimoku Cloud shows rising support, with positive band compression.
Projection: As long as the price holds above $594, there is potential to test the $610–$615 area.
Daily Chart (Medium-Term View)
Fibonacci Levels: The 0.786 level was broken decisively, indicating strong bullish momentum.
Trend: Clearly bullish, supported by declining volume on pullbacks and steady upward movement.
Volume: Consistent increase in buying volume since April strengthens the bullish case.
Upcoming Resistance: $610–$615 (previous highs).
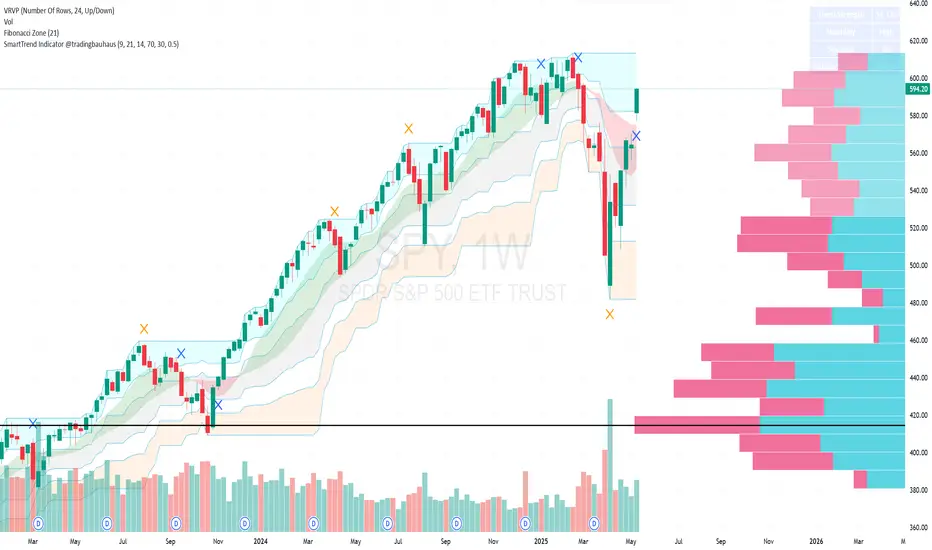
Weekly Chart (Long-Term View)
Recovery: A solid rebound from the March lows.
VPVR: The high-volume node between $455 and $475 has been left behind, now acting as a structural support.
Macro Trend: Price has returned to a previous consolidation area from the prior bull market.
Risks: While there is room for further upside, the $610 area could act as both technical and psychological resistance.
Key Levels
Immediate Resistance: $610–$615
Technical Support: $594–$596
Structural Support: $560 (significant volume cluster)
Conclusion
SPY maintains a strong bullish structure across all timeframes, with sustained upward momentum and room to challenge previous highs. The reaction around the $610 zone will be critical. As long as price holds above $594, the structure remains favorable for buyers. However, given the lack of historical volume in this price range, short-term volatility or pullbacks are possible.
Disclaimer:
This analysis is intended for informational and educational purposes only. It does not constitute financial advice or an investment recommendation. Always assess your own risk profile and consult a licensed professional before making investment decisions.
Trend: Ongoing bullish momentum with dominant green candles.
Key Breakout: Strong breakout above the $594–$596 resistance zone, which now acts as support.
Volume Profile (VPVR): A low-volume area between $595 and $610 suggests potential for a swift move higher.
Indicators: The Ichimoku Cloud shows rising support, with positive band compression.
Projection: As long as the price holds above $594, there is potential to test the $610–$615 area.
Daily Chart (Medium-Term View)
Fibonacci Levels: The 0.786 level was broken decisively, indicating strong bullish momentum.
Trend: Clearly bullish, supported by declining volume on pullbacks and steady upward movement.
Volume: Consistent increase in buying volume since April strengthens the bullish case.
Upcoming Resistance: $610–$615 (previous highs).
Weekly Chart (Long-Term View)
Recovery: A solid rebound from the March lows.
VPVR: The high-volume node between $455 and $475 has been left behind, now acting as a structural support.
Macro Trend: Price has returned to a previous consolidation area from the prior bull market.
Risks: While there is room for further upside, the $610 area could act as both technical and psychological resistance.
Key Levels
Immediate Resistance: $610–$615
Technical Support: $594–$596
Structural Support: $560 (significant volume cluster)
Conclusion
SPY maintains a strong bullish structure across all timeframes, with sustained upward momentum and room to challenge previous highs. The reaction around the $610 zone will be critical. As long as price holds above $594, the structure remains favorable for buyers. However, given the lack of historical volume in this price range, short-term volatility or pullbacks are possible.
Disclaimer:
This analysis is intended for informational and educational purposes only. It does not constitute financial advice or an investment recommendation. Always assess your own risk profile and consult a licensed professional before making investment decisions.
Join my trading community on Discord! 📈 Use all our indicators for FREE
discord.gg/xPEDcNEupw
discord.gg/xPEDcNEupw
Disclaimer
The information and publications are not meant to be, and do not constitute, financial, investment, trading, or other types of advice or recommendations supplied or endorsed by TradingView. Read more in the Terms of Use.