🌀  SPY – Spiral Timing, Macro Tension, and Bearish Momentum Brewing
Not financial advice. Short-term sentiment shifted bearish.
I’ve been trackingSPY using both Fibonacci retracements and Fib spirals across the daily and weekly timeframes, and we’re now at a critical inflection zone. My sentiment has shifted more cautiously bearish in the short term, while acknowledging upside remains intact on the longer timeframes.
🔍 Macro Backdrop: Pressure Building
CPI Data (May) came in at 2.4%, slightly higher than April’s 2.3%, but still below forecast — showing inflation is sticky but not accelerating.
Geopolitical tensions between Israel and Iran flared again over the weekend, adding risk-off pressure to already fragile sentiment.
Market volatility remains high, with trillions of dollars swinging across a narrow window — validating shorter Fib cycles and accelerated price exhaustion.
🧭 Daily Chart Analysis: December 2024 High → April 2025 Low
I used a bearish Fib retracement from the December 2024 highs to the April 2025 lows.
SPY has now retraced nearly 100% of that drop, currently hovering between the 0.786 and 0.886 retracement levels — which often act as exhaustion zones in corrective rallies.
The Fib spiral from the April low shows we’ve lost the initial vertical trendline that marked the recovery leg — a shift in momentum tone.
MACD has remained flat for 16 sessions, with a bearish divergence confirmed on Friday (6/13/25).
Momentum, which briefly turned positive on Thursday, flipped sharply back negative by week’s end.
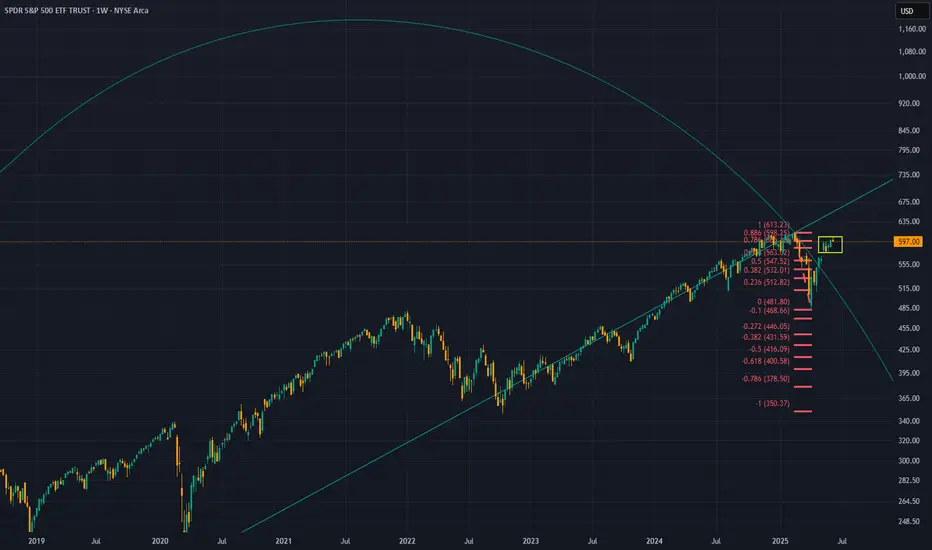
📆 Weekly Chart Structure: March 2020 → Feb 2025
The weekly spiral, drawn from the March 2020 low to the February 2025 high, reflects a similar pattern:
→ Price is moving beyond the arc and approaching the vertical time marker, a zone where reversals or expansions often occur.
Long-term trend remains bullish, but short-term action suggests compression ahead of a possible pullback.
🔥 Spiral Interpretation Reminder:
The Fib spiral doesn’t predict direction — it identifies time-based pressure points.
When price crosses the arc or vertical band, volatility often follows.
🎯 Key Trade Levels:
Breakdown Watch:
→ Close below $595, then $587 could trigger downside toward $560 (0.618) and $545 (0.5) levels from the retracement
Breakout Watch:
→ A confirmed breakout above $609 (full retrace from the Fib) would invalidate the short-term bear thesis and resume bullish continuation
🤔 Positioning Outlook:
I’m tactically bearish here. The technicals show:
Momentum divergence
Fib exhaustion
Spiral confluence
Macro pressure mounting
I don’t think the long-term trend is broken — but we’re entering a time window for volatility, and that often brings opportunity on both sides. Short setups may offer better risk/reward right now if we see confirmation.


Would love to hear your bias here — bear trap brewing or topping process?
Not financial advice. Short-term sentiment shifted bearish.
I’ve been tracking
🔍 Macro Backdrop: Pressure Building
CPI Data (May) came in at 2.4%, slightly higher than April’s 2.3%, but still below forecast — showing inflation is sticky but not accelerating.
Geopolitical tensions between Israel and Iran flared again over the weekend, adding risk-off pressure to already fragile sentiment.
Market volatility remains high, with trillions of dollars swinging across a narrow window — validating shorter Fib cycles and accelerated price exhaustion.
🧭 Daily Chart Analysis: December 2024 High → April 2025 Low
I used a bearish Fib retracement from the December 2024 highs to the April 2025 lows.
SPY has now retraced nearly 100% of that drop, currently hovering between the 0.786 and 0.886 retracement levels — which often act as exhaustion zones in corrective rallies.
The Fib spiral from the April low shows we’ve lost the initial vertical trendline that marked the recovery leg — a shift in momentum tone.
MACD has remained flat for 16 sessions, with a bearish divergence confirmed on Friday (6/13/25).
Momentum, which briefly turned positive on Thursday, flipped sharply back negative by week’s end.
📆 Weekly Chart Structure: March 2020 → Feb 2025
The weekly spiral, drawn from the March 2020 low to the February 2025 high, reflects a similar pattern:
→ Price is moving beyond the arc and approaching the vertical time marker, a zone where reversals or expansions often occur.
Long-term trend remains bullish, but short-term action suggests compression ahead of a possible pullback.
🔥 Spiral Interpretation Reminder:
The Fib spiral doesn’t predict direction — it identifies time-based pressure points.
When price crosses the arc or vertical band, volatility often follows.
🎯 Key Trade Levels:
Breakdown Watch:
→ Close below $595, then $587 could trigger downside toward $560 (0.618) and $545 (0.5) levels from the retracement
Breakout Watch:
→ A confirmed breakout above $609 (full retrace from the Fib) would invalidate the short-term bear thesis and resume bullish continuation
🤔 Positioning Outlook:
I’m tactically bearish here. The technicals show:
Momentum divergence
Fib exhaustion
Spiral confluence
Macro pressure mounting
I don’t think the long-term trend is broken — but we’re entering a time window for volatility, and that often brings opportunity on both sides. Short setups may offer better risk/reward right now if we see confirmation.
Would love to hear your bias here — bear trap brewing or topping process?
Disclaimer
The information and publications are not meant to be, and do not constitute, financial, investment, trading, or other types of advice or recommendations supplied or endorsed by TradingView. Read more in the Terms of Use.
Disclaimer
The information and publications are not meant to be, and do not constitute, financial, investment, trading, or other types of advice or recommendations supplied or endorsed by TradingView. Read more in the Terms of Use.