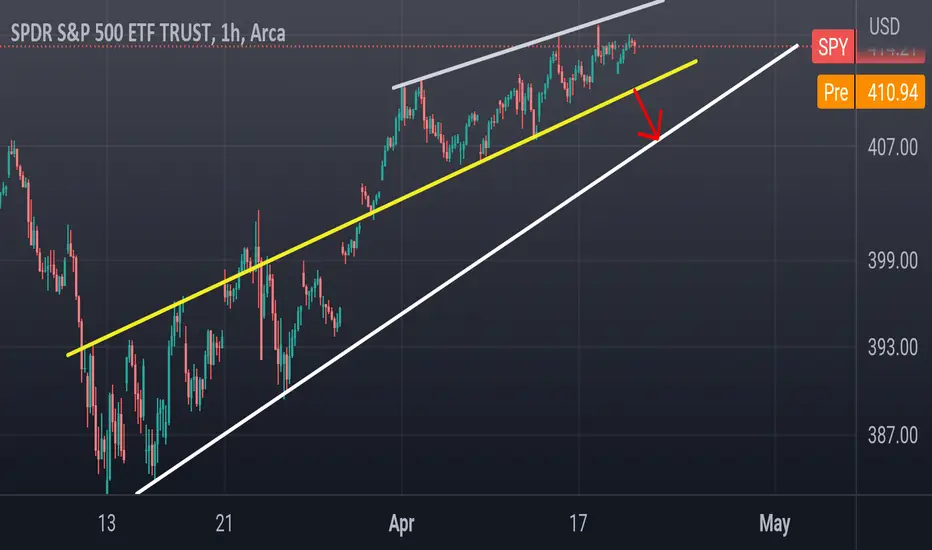
Short below 411.00 (Yellow trendline)
Target 407-408 (White trendline)..
If it doesn't break below 411 DONT SHORT.
If 411 holds, we retest 414.
Tech is leading the sell so I would watch for the area of 315.50 on QQQ
If it breaks 315, then qqq most likely we'll go to fill gap at 313 and that means spy is coming with it

Dow jones is also breaking support of a wedge (White)

My target like spy is the supporting trendline below from March lows to close gap at 33,600
If we break 407 , then the April run is over, if we don't break it then this is just a pullback before 418
Target 407-408 (White trendline)..
If it doesn't break below 411 DONT SHORT.
If 411 holds, we retest 414.
Tech is leading the sell so I would watch for the area of 315.50 on QQQ
If it breaks 315, then qqq most likely we'll go to fill gap at 313 and that means spy is coming with it
Dow jones is also breaking support of a wedge (White)
My target like spy is the supporting trendline below from March lows to close gap at 33,600
If we break 407 , then the April run is over, if we don't break it then this is just a pullback before 418
Note
Here's QQQ daily chart.The blue wave is the 20sma
The white wave is the 21ema
And also you can see the fib support at 315.50
As you can see all throughout April's fawkery QQQ has never close beneath either MA and had a major bounce off it
4/12.
A close beneath all 3 is very bearish. Could see some bouncing around in that area.
Note
3 hour chart on the vix here..Descending broadening wedge..
We are at resistance this morning as you can see on the chart and RSI
It if fizzles out again the market could rally back again.
If it breaks out then it's game on to 20
Note
TSM is pumping the chip sector.Tesla has bounced at 165 support...
Most likely going to close gap yo the upside on QQQ
Note
Vix wants sub 16.00 and test supportNote
NQ has a little more room to go which should help QQQ push to 319.. after that you should have a tight stop , wait and see
Here's QQQ 15min chart.
Regained trendline support around 317.50..
Should go and close gap..
Stop losses at 316.75
Note
Es wants 4174 Note
Nothing getting a bid from here right now... 318 maybe the high of the day for QQQ..
21ema on was the brick wall . At this point only long above 319..
Short below 315...
In-between that is chop hell
Note
The 2 biggest stocks Aapl and Msft both are still holding supports.
Those supports are
Aapl - 165
Msft -283
It'll be hard for bears to get BIG SELL they want as long as those 2 hold the market up.
Also googl is a 1.4 trillion dollar company that also doesn't want to bend .
The more Tsla goes down, the more you'll see them Pump msft and aapl.. this tactic balances the spy out amd keeps it from breaking support (Manipulation).
So you have to ask your self, why are they keeping it up? I think it's because they want 418 minimum before April I up.
When's the last time you seen 2 big tech companies tank and spy is only down .5%?
NFLX is already back at its levels from the start of the week..
Only thing that stood out very bearish to me was NYSE or NYA. Finished yesterday with a hangman candle and if we close below yesterday's candle that would confirm it
But as always I prefer to use QQQ for direction and unless it closes below it's 20 and 21 ma they'll keep this up.
Note
XLK..With the Exception of the bear trap or circled area
Everytime XLK has bounced dips were bought on Aapl,NVda, and Msft.
If we break that white resistance, alot of tech will go green
Note
Qqq 5min..Bullish
Note
And now NFLX closes its gapNote
NQ
Back at that 13,200 resistance
The momentum is bullish but u have to place stops on your calls here
Same with QQQ..
A break over 320 and it's a double bottom to 322
Note
Spy intra dayRetesting previous support
415 is target.
413.00 stop loss
Note
Blow off topNote
Coiled here
If it gaps opens over 17.75 we gap down
Spy bounced off trendline as vix rejected
Note
Spy daily chart using lines instead of candles. Charting with lines has its benefits especially spotting patterns.Here I used it to show how spy is On the edge here and to show what happened last time trendline support was broken.
Now I know I've called for 418 spy and 322 QQQ but no matter what you try to predict , you have to react; and that's the difference between a trader and a chartist.
Here's QQQ daily chart. Line and candle
A wedge within a wedge .. also closed on minor wedge trendline.
Tomorrow will be either another saving grace or 1¼% down for QQQ and SPY.
This for me would be strange because they normally don't have a correction in the middle of big tech earnings or April.. They usually save the rug pull post aapl earnings
NQ 4 hour chart shows a falling wedge
The money flow is neutral but the 4hour RSI has been pretty reliable on the price action
As you can see we are in the middle here .
Let's see what happens tomorrow
Note
We bounced off that yellow trendline late yesterday on spy . That white trendline that was the 411 support from yesterday will now act as resistance under 411.90Here's a 15min chart stripped down so you can see what I'm seeing.
Over head resistance after 411.90 is 413.00
Since support is sloping we could land anywhere between 409.50 and 410.00
Since we bounced off that yellow support yesterday I would consider a fall through that support a risk off event that would take us to 407.50...
Otherwise it's going to be a tight range today
Some things I notice
Vix struggling premarket again at 17.70
Aapl bouncing off trendline support at 164.10. Remember I said the market usually tops when Apple does, so watch for a breakdown of 164.00..
And lastly meta is opening up directly above its 21ema at 210.40. If it breaks that
206 and 201 gap close will follow..
So far premarket NQ has tested its 21ema at 13,000 and bounced .
Note
For the bulls bias..A breakout over 413.50
And 416.50 next
Note
First trade of the day FCX
38.50p
4/28
Note
Xlk broke beneath 21ema bearish for techNote
313pQqq
4/24
315.50 stop
Note
Hit my stop QQQ..That pop.. left field
Note
Dead cat .. more selling to comeOpening range most stocks 15min rsi was in the 20.. the bounce was the recovery
Note
NQCan't get over 13075
But bounced at 12099..
That's our range .
Once 12099 gives it flushes hard
Note
12,991 .. typoim sorryNote
So far, spy is ranging between trendlien support and 1hout 50sma
Until one breaks u might just have to scalp at each intersection
Note
Well FCX is dropping. XME sector is down the most . this is why I hate ETFs on witching days..
Straight chop..
One thing I noticed Amzn pushed up to its 200sma and pulled back. I don't think it will break it before earnings.. but I have to be honest , the stock looks bullish. Same with Googl.
Note
Best sector to short right now is METALSXME sector..
I think may will be very bloody for metal stocks.. Major H&S at play
Drop below it's Daily 200sma and weekly 50..
If XME closes below 50.00 , metals could see more selling early next week
Note
Looking a the vix 30min CCI we should see a spike that wshould take spy back to Intra day lows before the close. But I think 408 is out of the question for today. Maybe 409.50 and I can't guarantee it doesn't bounce rally before the close ..Aapl hasn't lost that support I told you about earlier, they are just keeptnit suppressed beneath 165.50
Meta bounced also..
I'll be back last hour
Note
Vix at supportNq at resistance
Careful if long now
Note
Here's .SPY
IWM
DJI
NYSE
IXIC
Everything closed at the too of a channel friday if we gap up then markets will rally starting the week. If we gap down just play the ranges. Until it breaks out or down of such a tight range expect Sunday. I went into the weekend short FCX and QQQ. Let's see what happens Monday.
I'll do a new post sunday.
Enjoy the weekend
Related publications
Disclaimer
The information and publications are not meant to be, and do not constitute, financial, investment, trading, or other types of advice or recommendations supplied or endorsed by TradingView. Read more in the Terms of Use.
Related publications
Disclaimer
The information and publications are not meant to be, and do not constitute, financial, investment, trading, or other types of advice or recommendations supplied or endorsed by TradingView. Read more in the Terms of Use.