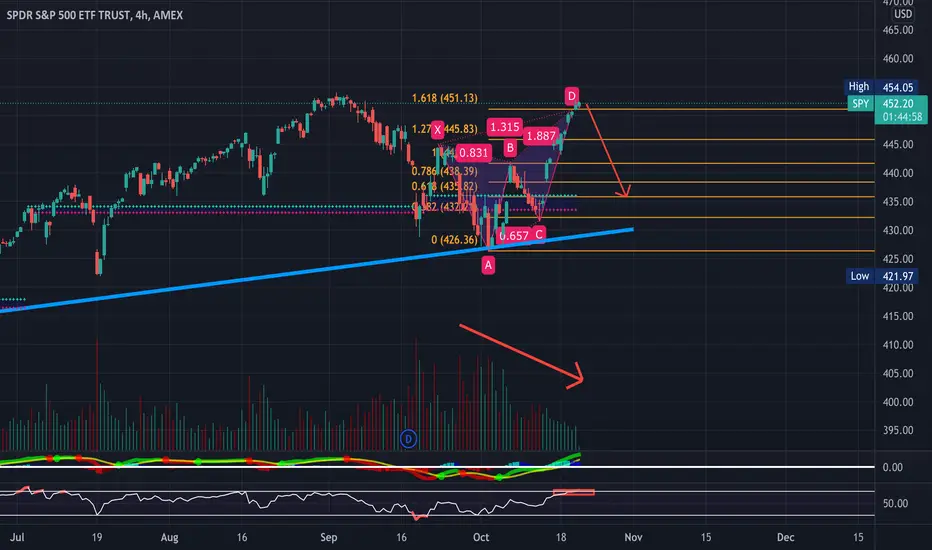
SPY looking pretty bearish here (See Previous Charts Below)- Some FIB levels and RSI-based supply and demand zones to keep an eye on-
- Bearish Butterfly Harmonic Pattern Formed
- Decreasing Volume on the 4 hour, daily, and weekly timeframe
- RSI in Overbought Territory
Previous Charts-
https://tradingview.sweetlogin.com/i/WN0uJ4TR/
https://tradingview.sweetlogin.com/i/f17iU8Xs
https://tradingview.sweetlogin.com/i/Xa80n3Y1
- Bearish Butterfly Harmonic Pattern Formed
- Decreasing Volume on the 4 hour, daily, and weekly timeframe
- RSI in Overbought Territory
Previous Charts-
https://tradingview.sweetlogin.com/i/WN0uJ4TR/
https://tradingview.sweetlogin.com/i/f17iU8Xs
https://tradingview.sweetlogin.com/i/Xa80n3Y1
Disclaimer
The information and publications are not meant to be, and do not constitute, financial, investment, trading, or other types of advice or recommendations supplied or endorsed by TradingView. Read more in the Terms of Use.
Disclaimer
The information and publications are not meant to be, and do not constitute, financial, investment, trading, or other types of advice or recommendations supplied or endorsed by TradingView. Read more in the Terms of Use.