Where is the Stock Market Heading? 📈📉
Stock Market Forecast & Analysis🧵
In this thread, we’re breaking it down for you:
-TA on VIX
VIX  QQQ
QQQ  SPY
SPY  IWM VIX
-Economic Data
-Insights & Predictions
Let's dive in friends!
Not financial advice
QQQ
Monthly Chart analysis:
-H5 Indicator is GREEN
-We are above 9ema and smoothing avg.
Most importantly we are still within our Williams Consolidation Box which is my personal strategy I use with the Wr%. As long as we stay within the confines of this Box we will continue to climb higher on the Q's outside of pullbacks.
Weekly Chart Analysis:
-H5 Indicator is GREEN
-Held volume shelf
-Wicked back above 9ema (BULLISH)
-Ascending triangle patterns Measured Move has not been realized yet. $580
-Created a Hammer Candle which is a reversal candle found at the bottom of downtrends, pullback, or corrections.
Had a Normal 6% Pullback and bounced hard around the S/R Zone. Everything I'm seeing is BULLISH going into CES2025 week and I believe we continue back to ATH's!

VIX
First up we have the VolatilitySPY Index which spiked up due to the FED dropping a FUD Nuke on the markets heading and causing the largest one day volatility spike in 2024.
But, as you see below we have fallen in line since that day. We have created a bearish flag pattern and broken down through the base and should continue to flush lower.
Keep in mind 60-70% of breakouts (either direction) come back to retest the point of the breakout area. Could see this happen with FOMC minutes being released this Wednesday.

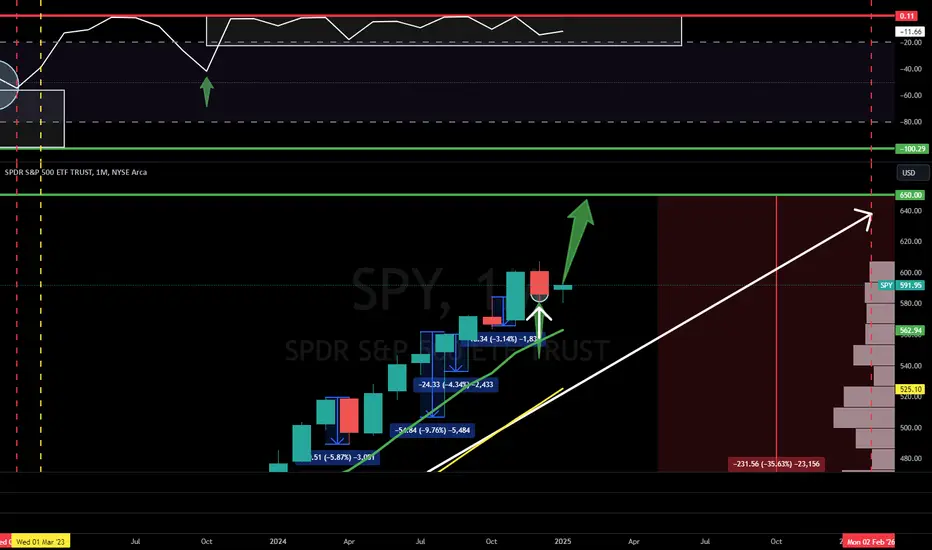
SPY
Monthly Chart analysis:
-H5 Indicator is GREEN
-We are above 9ema and smoothing avg.
-Wicked off previous resistance flipped into support
Most importantly we are still within our Williams Consolidation Box and thriving! $650 2025 PT!

Weekly Chart Analysis:
-H5 Indicator is GREEN
-Wicked back above smoothing line
-Created a Hammer Candle right above 9ema
Had a Normal 4.35% Pullback and bounced hard around the S/R Zone. Everything I'm seeing is BULLISH going into CES2025 week and I believe we continue back to ATH's on the SPY!

IWM
As I've stated in other posts the RTY typically runs and plays catchup to the SPY and QQQ towards the end of bull runs and before the big corrections or crash comes.
Weekly Chart Analysis:
-At the bottom of an uptrend channel
-Sitting on a massive volume shelf
-At a massive S/R area
-At the retest point for the Multi-Year CupnHandle breakout! With a Measured Move up to $306. Thats the same measurement of theRTY catching back up to the $SPY.

USCIR - Core Inflation Rate YoY
Inflation is dead and falling like a rock! I don't hold any weight into what the FED was saying about inflation when he was the Grinch and spreading FUD.
The FED is always to slow to do what is needed to be done and right now that is to continue to cut before things in the economy start to break due to higher rates. They raised rates to SLOW and they are choosing to cut rates to SLOW!
What I'm seeing is we will continue to fall with small pockets of bounce backs in inflation on the overall down trend to sub 3 then sub 2 as you can see on the chart with the yellow levels.

Overall Economic numbers are very positive and have been beating what the experts have been forecasting in December.
We have some more data coming out this week and we will see if that trend continues.
Like I said in a separate post, the FED has been talking about a boogeyman and spreading FUD but the DATA and NUMBERS show the BOOGEYMAN isn't REAL!
Thanks for reading friend! If you enjoyed this analysis and forecast of the markets please like/ follow/ share if you feel I deserved it!
ALL SOCIALS/ LINKS IN SIGNATURE BELOW AND PROFILE.
Stock Market Forecast & Analysis🧵
In this thread, we’re breaking it down for you:
-TA on
-Economic Data
-Insights & Predictions
Let's dive in friends!
Not financial advice
Monthly Chart analysis:
-H5 Indicator is GREEN
-We are above 9ema and smoothing avg.
Most importantly we are still within our Williams Consolidation Box which is my personal strategy I use with the Wr%. As long as we stay within the confines of this Box we will continue to climb higher on the Q's outside of pullbacks.
Weekly Chart Analysis:
-H5 Indicator is GREEN
-Held volume shelf
-Wicked back above 9ema (BULLISH)
-Ascending triangle patterns Measured Move has not been realized yet. $580
-Created a Hammer Candle which is a reversal candle found at the bottom of downtrends, pullback, or corrections.
Had a Normal 6% Pullback and bounced hard around the S/R Zone. Everything I'm seeing is BULLISH going into CES2025 week and I believe we continue back to ATH's!
First up we have the Volatility
But, as you see below we have fallen in line since that day. We have created a bearish flag pattern and broken down through the base and should continue to flush lower.
Keep in mind 60-70% of breakouts (either direction) come back to retest the point of the breakout area. Could see this happen with FOMC minutes being released this Wednesday.
Monthly Chart analysis:
-H5 Indicator is GREEN
-We are above 9ema and smoothing avg.
-Wicked off previous resistance flipped into support
Most importantly we are still within our Williams Consolidation Box and thriving! $650 2025 PT!
Weekly Chart Analysis:
-H5 Indicator is GREEN
-Wicked back above smoothing line
-Created a Hammer Candle right above 9ema
Had a Normal 4.35% Pullback and bounced hard around the S/R Zone. Everything I'm seeing is BULLISH going into CES2025 week and I believe we continue back to ATH's on the SPY!
As I've stated in other posts the
Weekly Chart Analysis:
-At the bottom of an uptrend channel
-Sitting on a massive volume shelf
-At a massive S/R area
-At the retest point for the Multi-Year CupnHandle breakout! With a Measured Move up to $306. Thats the same measurement of the
Inflation is dead and falling like a rock! I don't hold any weight into what the FED was saying about inflation when he was the Grinch and spreading FUD.
The FED is always to slow to do what is needed to be done and right now that is to continue to cut before things in the economy start to break due to higher rates. They raised rates to SLOW and they are choosing to cut rates to SLOW!
What I'm seeing is we will continue to fall with small pockets of bounce backs in inflation on the overall down trend to sub 3 then sub 2 as you can see on the chart with the yellow levels.
Overall Economic numbers are very positive and have been beating what the experts have been forecasting in December.
We have some more data coming out this week and we will see if that trend continues.
Like I said in a separate post, the FED has been talking about a boogeyman and spreading FUD but the DATA and NUMBERS show the BOOGEYMAN isn't REAL!
Thanks for reading friend! If you enjoyed this analysis and forecast of the markets please like/ follow/ share if you feel I deserved it!
ALL SOCIALS/ LINKS IN SIGNATURE BELOW AND PROFILE.
🖐️ High Five Strategies
📈 Stocks, Cryptos, ETFs, Levered ETFs
📱 Find me on other Socials
🌆 High Five Community 👇
whop.com/highfive-pro/
📈 Stocks, Cryptos, ETFs, Levered ETFs
📱 Find me on other Socials
🌆 High Five Community 👇
whop.com/highfive-pro/
Related publications
Disclaimer
The information and publications are not meant to be, and do not constitute, financial, investment, trading, or other types of advice or recommendations supplied or endorsed by TradingView. Read more in the Terms of Use.