WEEKLY RECAP:
S&P 500 TECHNICAL ANALYSIS:
FORECAST
I would expect continued volatility as markets weigh the likelihood of a Fed rate cut amid cooling inflation and labor softness. Historically one of the weakest months for equities, September may still offer opportunities—especially in small-cap and value stocks, which remain undervalued and have recently shown signs of strength. Sectors like healthcare, communications, and real estate are also expected to outperform as investors rotate away from overextended tech names.
DISCLOSURE
All information shared is entirely hypothetical and open to interpretation. One analyst may view the market through a particular lens, while another may see it differently—based on unique strategies, trade durations, entry/exit points, and sources. In other words, context matters. Past performance does not guarantee future results. Trading always involves risk, so please do your own research and form your own opinions. What works for Trader A might not work for Trader B.
Happy Trading!
- JOLTS data came in softer than expected, signaling cooling labor demand and providing hopes for a potential Federal rate cut.
- The jobs report showed signs of labor market weakness causing Treasury yields to fall. The dollar weakened in response.
- Speculation about Fed easing for potential rate cuts and whether to expect a soft landing or deeper economic slowdown.
- The U.S. stock market delivered mixed results.
- S&P 500 slightly edged up approximately 0.3% from last week.
- Nasdaq edge up approximately 1.1% with strength in tech.
- The Dow slipped approximately 0.5%
- On Friday
 SPY,
SPY,  NDAQ, DIA had opened up followed by some heavy selling.
 - The market tried to really towards the end of Friday.
- My view is that there is investor uncertainty
S&P 500 TECHNICAL ANALYSIS:
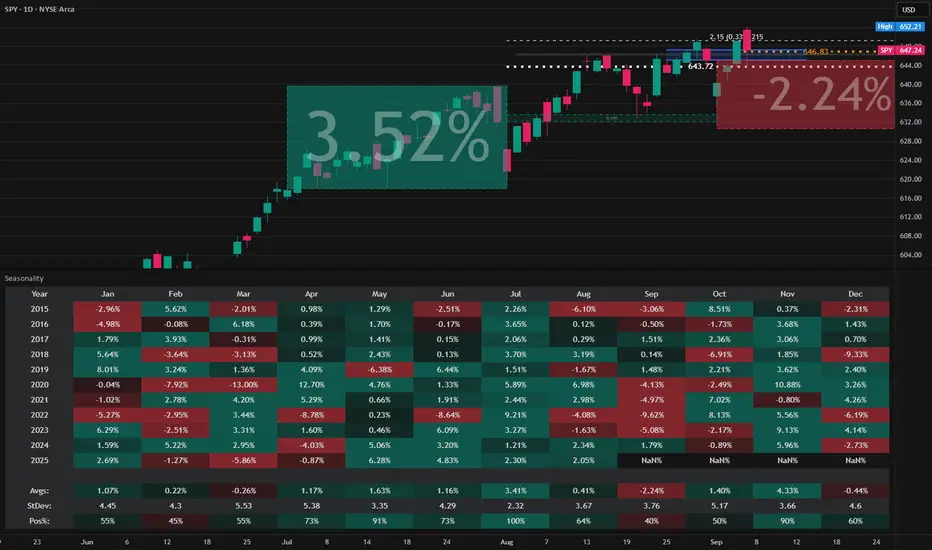
- Despite SPY edging up for the week, investor uncertainty remains with Friday closing on a wide range red candle and above average volume.
- The Friday candle formed a Dark Cloud Cover (DCC) on the Daily chart. Note that some technicians require the candle to push more than 50% into the body. While Friday's candle had a wide red body on above average volume, it only thrusted into the body of Thursday's candle by around 40%. Discretion is required. Everything is open for interpretation. There are no hard rules, except for good risk management, and knowing when to trade, and when not to trade.
- The Dark Cloud Cover candle strategy is said to have approximately a 60% win rate as per wrtrading data, depending on confirmation and market context.
- The Bears won on Friday but the Bulls put up a fight rallying into the close and forming a lower shadow. This is a strictly a personal view, but a lower shadow has much more significance near the bottom of a trend, rather than near the top. Had the rally been stronger a Hanging Man candle would have been formed, which is another candle considered to be bearish.
- Make no mistake, whether bullish or bearish, the bears are present.
- For the type of trader I am, I have the trend is marked as Neutral until support is broken. There still is considerable support.
- Some technicians may see the lower shadow and say Bulls are present, while others will look at it and say it's simply short sellers covering their positions to take profit.
- September has historically been the 2nd worst month of the year, for a 10-year lookback. For these reasons my bias is leaning towards a deeper pullback, which would be a nice Bull setup for a Santa rally for the stronger months of October, November, and December.
- For these reasons I would expect some volatility next week, but have the trend marked as Neutral until further confirmation, but with a Bearish bias for a pullback.
- This doesn't mean I think we're heading for a Bear market. It merely means the market moves up & down in waves and I'm leaning towards a pullback.
- A question you should ask yourself: If I'm an investor and looking at SPY, do I want to buy up here?
FORECAST
I would expect continued volatility as markets weigh the likelihood of a Fed rate cut amid cooling inflation and labor softness. Historically one of the weakest months for equities, September may still offer opportunities—especially in small-cap and value stocks, which remain undervalued and have recently shown signs of strength. Sectors like healthcare, communications, and real estate are also expected to outperform as investors rotate away from overextended tech names.
DISCLOSURE
All information shared is entirely hypothetical and open to interpretation. One analyst may view the market through a particular lens, while another may see it differently—based on unique strategies, trade durations, entry/exit points, and sources. In other words, context matters. Past performance does not guarantee future results. Trading always involves risk, so please do your own research and form your own opinions. What works for Trader A might not work for Trader B.
Happy Trading!
Disclaimer
The information and publications are not meant to be, and do not constitute, financial, investment, trading, or other types of advice or recommendations supplied or endorsed by TradingView. Read more in the Terms of Use.
Disclaimer
The information and publications are not meant to be, and do not constitute, financial, investment, trading, or other types of advice or recommendations supplied or endorsed by TradingView. Read more in the Terms of Use.