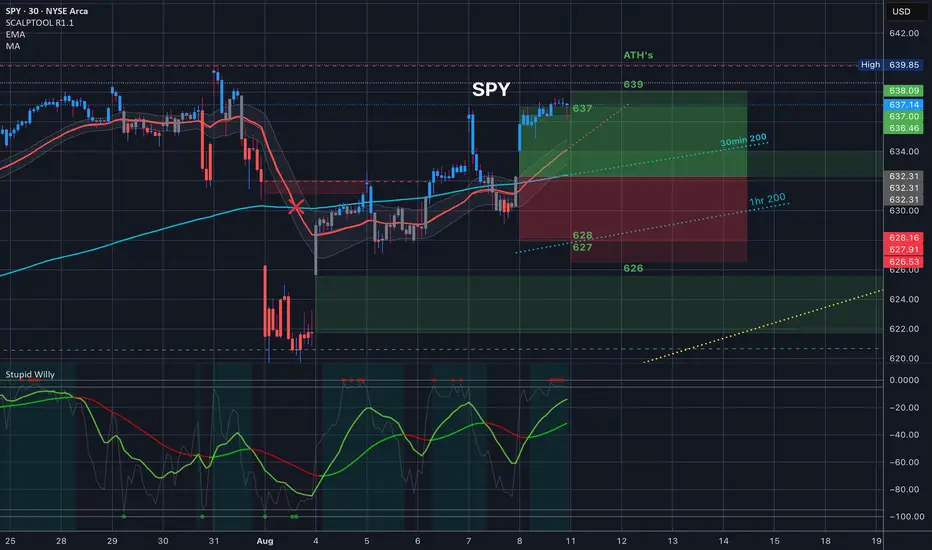
This is a review of last Friday’s price action. We opened with a gap up and a rally to the top of the implied move. We actually took it to the top of the 30 day average volatility, which rounded out was the same number 637.
The expected move for the next day (Monday) was 639 so spreads at 637/639 paid if you went in at 35% of the width of the spread (.70).
(hit GRAB THIS CHART) under the chart to populate my chart and setting onto your chart. 💃🏻
The expected move for the next day (Monday) was 639 so spreads at 637/639 paid if you went in at 35% of the width of the spread (.70).
(hit GRAB THIS CHART) under the chart to populate my chart and setting onto your chart. 💃🏻
Disclaimer
The information and publications are not meant to be, and do not constitute, financial, investment, trading, or other types of advice or recommendations supplied or endorsed by TradingView. Read more in the Terms of Use.
Disclaimer
The information and publications are not meant to be, and do not constitute, financial, investment, trading, or other types of advice or recommendations supplied or endorsed by TradingView. Read more in the Terms of Use.