🕰️ Daily Chart | May 21, 2025
🏢 Posted by: Wavervanir_International_LLC
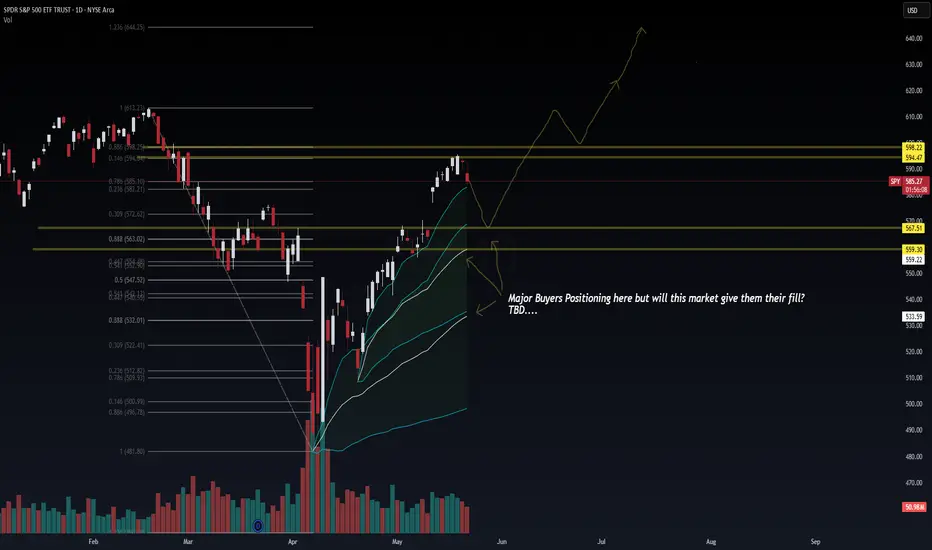
“Major buyers are lurking... but will the market deliver the fill they want?” That’s the question.
We’re currently watching a tactical rejection near 598.22, the 0.886 Fib retracement of the prior high-volume breakdown. This level historically serves as a liquidity sweep zone before decision-making candles emerge.
🔍 Technical + Volume Profile:
Liquidity Zones:
Resistance: 594.4–598.2 = prior supply + Fib confluence
Demand Zones:
567.5 → anchored VWAP / trend channel midpoint
559.3 → 0.618 Fib + major positioning cluster
Volume: Distribution volume into prior highs = possible short-term exhaustion
EMA Structure: Bullish stack but extended from mean; room for reversion to VWAP bands.
🧠 Macro Overlay:
Risk Events: Debt ceiling headlines are muted, but upcoming PCE inflation and labor data could dictate short-term gamma positioning.
Options Skew: OTM put volume rising; VIX curve remains steep in front-end → suggesting hedging or prep for pullback.
Macro Setup: Real yields are sticky, and the Fed is not signaling dovish pivot yet — any continuation will need confirmation via breadth and credit spreads.
🛡️ Risk Framework:
Reclaim 598.2: Bias flips bullish with upside into 613–644
Break Below 567.5: Opens doors for deeper retest at 559 or even 533
Neutral Range: 567.5–594.5 → Let market structure show intent before deploying size.
📌 Game Plan:
Let price come to you. Patience > Prediction. Market is deciding whether to reward early breakout traders or punish late longs via mean reversion. Watch the 567–559 cluster—that’s where smart money may reload.
—
🔗 #SPY #MacroTrading #VolumeAnalysis #RiskManagement #Fibonacci #Wavervanir #SP500 #LiquidityMap
🏢 Posted by: Wavervanir_International_LLC
“Major buyers are lurking... but will the market deliver the fill they want?” That’s the question.
We’re currently watching a tactical rejection near 598.22, the 0.886 Fib retracement of the prior high-volume breakdown. This level historically serves as a liquidity sweep zone before decision-making candles emerge.
🔍 Technical + Volume Profile:
Liquidity Zones:
Resistance: 594.4–598.2 = prior supply + Fib confluence
Demand Zones:
567.5 → anchored VWAP / trend channel midpoint
559.3 → 0.618 Fib + major positioning cluster
Volume: Distribution volume into prior highs = possible short-term exhaustion
EMA Structure: Bullish stack but extended from mean; room for reversion to VWAP bands.
🧠 Macro Overlay:
Risk Events: Debt ceiling headlines are muted, but upcoming PCE inflation and labor data could dictate short-term gamma positioning.
Options Skew: OTM put volume rising; VIX curve remains steep in front-end → suggesting hedging or prep for pullback.
Macro Setup: Real yields are sticky, and the Fed is not signaling dovish pivot yet — any continuation will need confirmation via breadth and credit spreads.
🛡️ Risk Framework:
Reclaim 598.2: Bias flips bullish with upside into 613–644
Break Below 567.5: Opens doors for deeper retest at 559 or even 533
Neutral Range: 567.5–594.5 → Let market structure show intent before deploying size.
📌 Game Plan:
Let price come to you. Patience > Prediction. Market is deciding whether to reward early breakout traders or punish late longs via mean reversion. Watch the 567–559 cluster—that’s where smart money may reload.
—
🔗 #SPY #MacroTrading #VolumeAnalysis #RiskManagement #Fibonacci #Wavervanir #SP500 #LiquidityMap
Disclaimer
The information and publications are not meant to be, and do not constitute, financial, investment, trading, or other types of advice or recommendations supplied or endorsed by TradingView. Read more in the Terms of Use.
Disclaimer
The information and publications are not meant to be, and do not constitute, financial, investment, trading, or other types of advice or recommendations supplied or endorsed by TradingView. Read more in the Terms of Use.