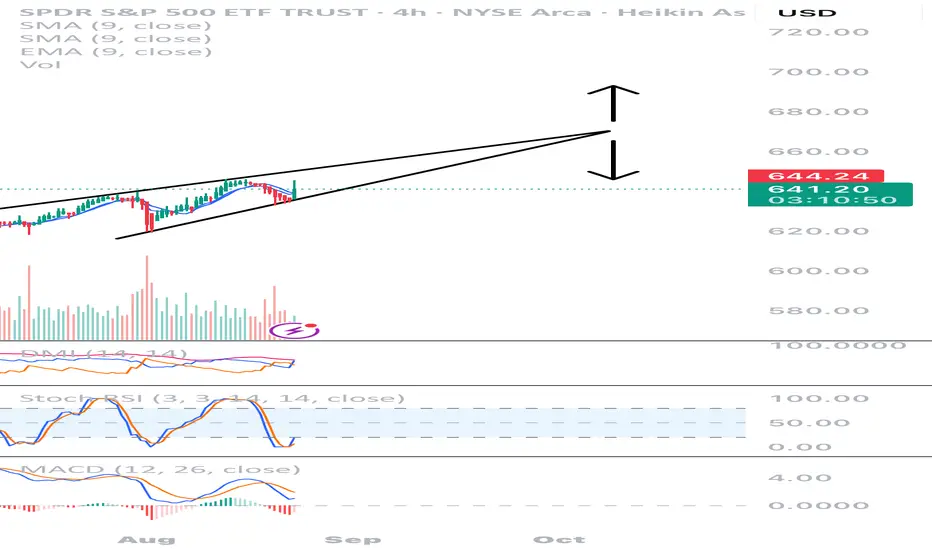
The SPY is continuing upward. I have the target as being around Oct. 9th.
There will be a few reports coming out that day including jobless claims, etc. But the market can always exit the triangle prior to the expected date usually around 2/3 to the tip of the triangle.
I suspect it will move lower in October but I will wait and see where the indicators are to make that judgement. As of right now, I have indicated both an up or downward movement.
I have posted the 4 hour chart as you can see the market is already bullish on the 4 hour chart but not the daily chart (just yet)
As I have said in my previous charts, I am a technical trader but I believe fundamentals drive the market.
I used the Heikin Ashi candles:
1: They show more of a directional movement.
2: They tend to filter out the market noise, so you can see the direction better.
3: it reduces false signals, allowing you to stay in the trade longer.
4: And it also gives a smoother appearance making it easier to see the trends and reversals.
Trade at your own risk, make sure you have stops in place and only use 10% of your trading account, so that if you are wrong, you will not blow up your account.
Happy trading!
(I am drawing this on my phone so I got to be quick! LOL!)
Trade active
I apologize if I am a little disorganized. I have limited access to a computer these days.There is a chance that the spy or SPX is trading in a channel like so....
Note
The market is still bullish as yesterday was just 1 bearish day. You can determine that the market is again bullish by the 25 min indicators and the 30 minute indicators. Based on the previous moves, I think we have another 5 more days until Friday, Sept. 5th before it declines. Below is the 25 minutes indicator which is showing it is bullish. It may open flat on Monday before heading up based on the 1 second, 10 second, 1 minute, 3 minute indicators.Disclaimer
The information and publications are not meant to be, and do not constitute, financial, investment, trading, or other types of advice or recommendations supplied or endorsed by TradingView. Read more in the Terms of Use.
Disclaimer
The information and publications are not meant to be, and do not constitute, financial, investment, trading, or other types of advice or recommendations supplied or endorsed by TradingView. Read more in the Terms of Use.