5 days graph: Bullish
1 month graph: Bullish
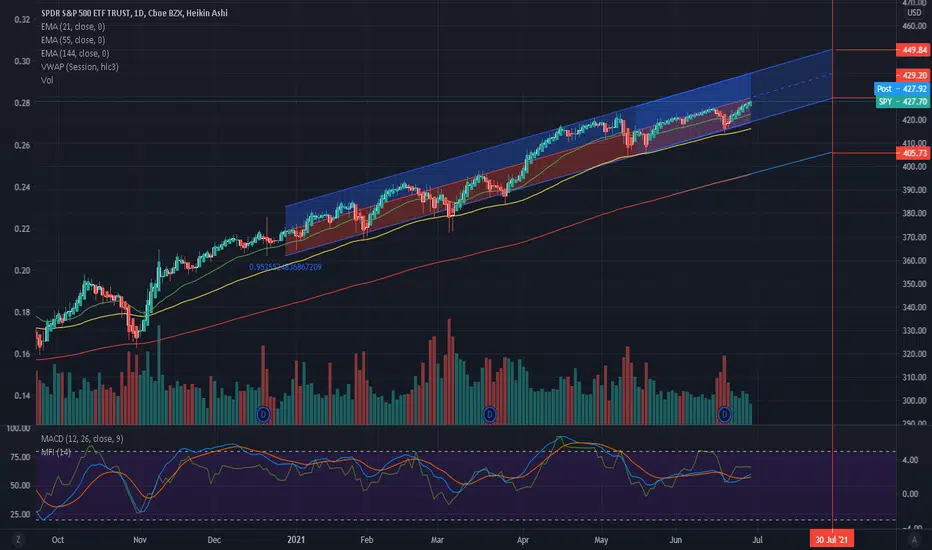
3 months graph: Bullish
6 months graph: Bullish
6 months MFI is oversold, market probably will come back down soon.
Correction might come soon.
1 month price range: $429 - $449
In case market break from pattern, correction expected to be +/- -7%, one month price after correction would be $405.
Disclaimer
The information and publications are not meant to be, and do not constitute, financial, investment, trading, or other types of advice or recommendations supplied or endorsed by TradingView. Read more in the Terms of Use.
Disclaimer
The information and publications are not meant to be, and do not constitute, financial, investment, trading, or other types of advice or recommendations supplied or endorsed by TradingView. Read more in the Terms of Use.