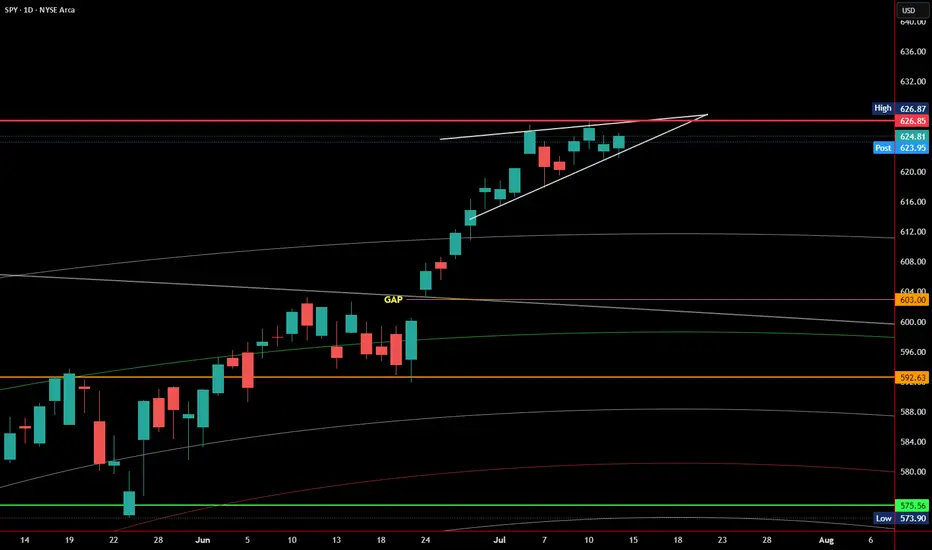
SPY continues to push higher, but today's candle reinforces a cautious tone as we approach a key inflection point.
The chart is currently forming a rising wedge pattern — historically a bearish structure that often precedes downside breaks, especially when forming after a strong upside move. Price is hugging the upper boundary of the wedge, with multiple failed breakout attempts near 626.87, which is acting as strong resistance.
The RSI sits at 68.59, just below the 70 overbought threshold. While this confirms strong bullish momentum, it also signals that the move may be getting stretched. A rejection here or a lower high on RSI while price continues higher could form a bearish divergence, a classic early reversal signal.
Volume remains moderate (~51.85M), and the candles have tightened — suggesting indecision. The rising wedge’s lower trendline and the short-term moving average (likely the 8 or 10 EMA) are immediate support. A break below these levels would shift the bias more clearly to the downside.
Key levels to watch:
If the wedge breaks down with a drop in RSI and a flip in momentum indicators (such as Parabolic SAR), it may open the door for a pullback toward previous support zones near 603 or even 592.63.
No confirmation yet, but the risk-reward here starts to shift away from chasing longs. Caution is warranted.
The chart is currently forming a rising wedge pattern — historically a bearish structure that often precedes downside breaks, especially when forming after a strong upside move. Price is hugging the upper boundary of the wedge, with multiple failed breakout attempts near 626.87, which is acting as strong resistance.
The RSI sits at 68.59, just below the 70 overbought threshold. While this confirms strong bullish momentum, it also signals that the move may be getting stretched. A rejection here or a lower high on RSI while price continues higher could form a bearish divergence, a classic early reversal signal.
Volume remains moderate (~51.85M), and the candles have tightened — suggesting indecision. The rising wedge’s lower trendline and the short-term moving average (likely the 8 or 10 EMA) are immediate support. A break below these levels would shift the bias more clearly to the downside.
Key levels to watch:
- Resistance: 626.87 (wedge top)
- Support: rising wedge lower boundary and EMA (around 620–622)
- RSI: break below 65 or a confirmed divergence would increase bearish risk
If the wedge breaks down with a drop in RSI and a flip in momentum indicators (such as Parabolic SAR), it may open the door for a pullback toward previous support zones near 603 or even 592.63.
No confirmation yet, but the risk-reward here starts to shift away from chasing longs. Caution is warranted.
Related publications
Disclaimer
The information and publications are not meant to be, and do not constitute, financial, investment, trading, or other types of advice or recommendations supplied or endorsed by TradingView. Read more in the Terms of Use.
Related publications
Disclaimer
The information and publications are not meant to be, and do not constitute, financial, investment, trading, or other types of advice or recommendations supplied or endorsed by TradingView. Read more in the Terms of Use.