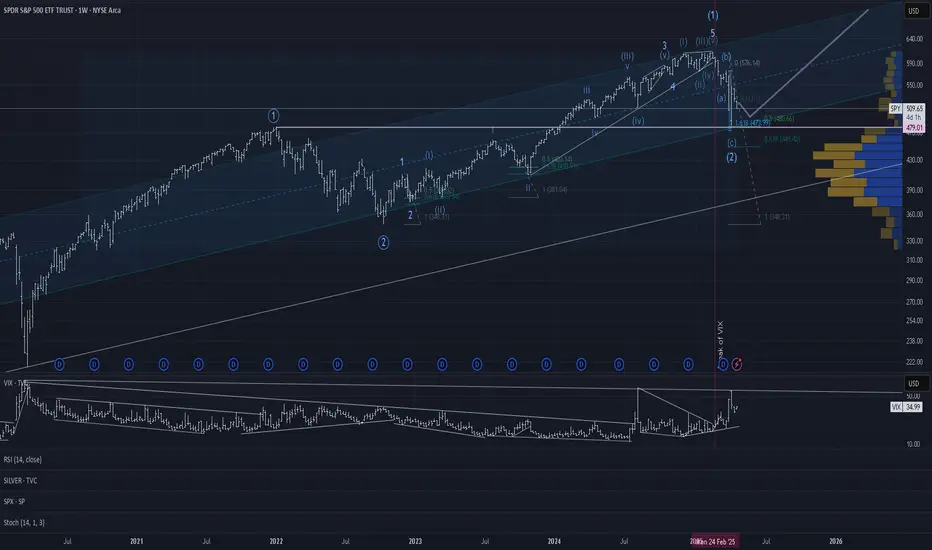
SPY seems to have reached the bottom of the correction and should now slowly begin an uptrend again. Confluence with high volume support below these levels, VIX peaked, correction wave C to more than 100% of leg A, support by the earlier top.
Further downside of course possible, but at this point it makes sense to hold the positions as the market is very oversold.
Further downside of course possible, but at this point it makes sense to hold the positions as the market is very oversold.
Note
Groks opinion:The attached chart shows an Elliott Wave (EW) count for the SPDR S&P 500 ETF Trust (SPY) on a weekly timeframe, posted on TradingView by user "jespergarm" on April 21, 2025. Here’s my analysis of the EW count:
1. **Overall Structure**: The chart suggests a long-term bullish trend within a larger Elliott Wave structure. The count indicates that SPY has completed a five-wave impulse (labeled I through V) from around 2020 to late 2024, reaching a peak near 600. This is followed by a corrective wave labeled (A), which appears to be in progress, dropping to around 500 as of the chart's date.
2. **Wave Details**:
- **Wave I to V**: The impulse wave structure from 2020 to 2024 looks reasonable. Wave III (labeled III) is the longest, which aligns with Elliott Wave principles where the third wave is often the most extended. Wave V appears to have completed a five-wave substructure (i through v), hitting resistance at the upper channel line.
- **Wave (A) Correction**: The current decline is labeled as wave (A) of a larger corrective pattern (likely an A-B-C zigzag). The drop to around 500 tests the midline of the channel, which is a common retracement level for wave A corrections.
3. **Support and Resistance**:
- The chart shows a parallel channel with the price testing the midline around 500, which acts as support. This level also aligns with the 38.2% Fibonacci retracement of the entire wave I-V move (though not explicitly drawn).
- The lower channel line, around 400-420, could be the next support if the correction deepens into wave (C).
4. **Potential Scenarios**:
- If wave (A) is complete at 500, we might see a wave (B) rally back toward 550-570 (near the upper channel or previous wave iv of V).
- After wave (B), wave (C) could push lower, potentially targeting 400-420, which would complete the A-B-C correction.
- Alternatively, if the correction becomes more complex (e.g., a flat or triangle), the price might consolidate rather than drop sharply.
5. **Volume and Indicators**:
- The volume bars on the right show a mix of buying and selling pressure, with no clear trend. This is typical during corrective phases.
- The chart includes indicators like VIX, RSI, and Stochastics, but they’re not clearly visible or labeled for detailed analysis. Generally, a corrective wave might coincide with rising VIX and oversold RSI/Stochastics, which could signal a potential bottom for wave (A).
**Conclusion**: The EW count appears plausible, with the current wave (A) correction fitting within the larger bullish channel. The price is at a key support level around 500, and the next moves will depend on whether this holds (leading to a wave (B) bounce) or breaks (leading to a deeper wave (C) decline toward 400-420). To confirm the count, I’d need more data on subwave structures and indicator readings, which aren’t fully clear here. If you’d like, I can search for more recent SPY data to refine this analysis.
Disclaimer
The information and publications are not meant to be, and do not constitute, financial, investment, trading, or other types of advice or recommendations supplied or endorsed by TradingView. Read more in the Terms of Use.
Disclaimer
The information and publications are not meant to be, and do not constitute, financial, investment, trading, or other types of advice or recommendations supplied or endorsed by TradingView. Read more in the Terms of Use.