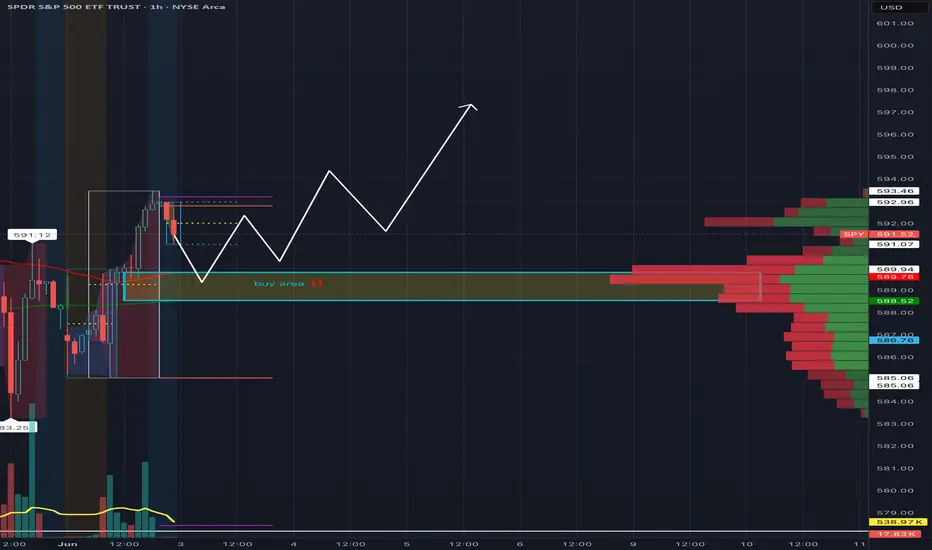
I’m watching the 588.52–589.94 range as a high-probability buy zone on the SPY 1-hour chart. This zone aligns with a strong volume shelf, indicating prior institutional accumulation and heavy transaction flow.
After a sharp move into the 591s, we’re seeing some hesitation and potential for a healthy pullback. The plan is to wait for price action to return to the buy zone, show signs of strength (e.g., hammer candle, strong bounce), and look for a continuation toward the previous high of 593.46 and possibly higher.
🔹 Buy Zone: 588.52–589.94
🔹 Volume Profile Support: High node at ~589
🔹 Resistance: 591.12 short-term, then 593.46
🔹 Stop Loss: Below 586.76 to avoid false breakouts
🔹 Target: 593.50+ with higher timeframe continuation in mind
Arold Norelus (him)
Disclaimer
The information and publications are not meant to be, and do not constitute, financial, investment, trading, or other types of advice or recommendations supplied or endorsed by TradingView. Read more in the Terms of Use.
Arold Norelus (him)
Disclaimer
The information and publications are not meant to be, and do not constitute, financial, investment, trading, or other types of advice or recommendations supplied or endorsed by TradingView. Read more in the Terms of Use.