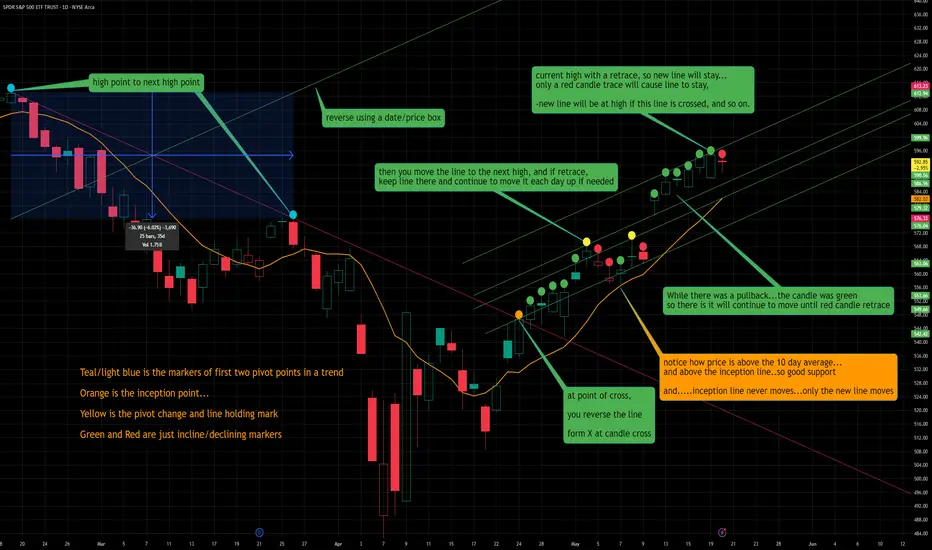
All the annotations speak for themselves...
but just a simple idea to see if there are levels that make sense if the descending line were to be reversed and applied to the ascending trend.
Have to follow those rules, and if too cluttered on choppy weeks- then hold the bottom line and only increase the newest line if you have price chopping greater than the height of the biggest candle in said chop.
ergo, if the biggest candle is say 4 point up from the last trend line off the inception permanent line ascending trend, then hold that line at the high of that day until price breaks above it. If chops continues above it, then draw another parallel 4 points (the height of that largest candle before the chop started) above the original line and hold it there until the chop continues up or is reverts and heads back down.
If you want to see if chop is a flag formation, then take the above example of a big candle up marking a new parallel line high and see if price for 3-4 days stays within it, pull down another parallel from that high and put it on that low...will allow for visual where the flag boundaries may be...
BTC 4hr examples:
Trade active
see how lines of equal ascending lines can help you spot what indicators may see...
Just a playful though to try for yourselves...
Trade closed: target reached
closer 4hr and 1 hr views with the added bear flag blue ascending bottoms in placeNote
PS...trade not closed...just the update that the lines are holding and the bottom bear is acting as resistance for now..will be by 1:23pm the outcomeNote
kinda still obeying the previous line of ascending tops
Note
Negative trend lines (descending) engaging on 1hr chart...
Using bear flag top and bottom candle approach...recent red candle hit green ascdending line and bounced off, needs to break that to still move up.
Disclaimer
The information and publications are not meant to be, and do not constitute, financial, investment, trading, or other types of advice or recommendations supplied or endorsed by TradingView. Read more in the Terms of Use.
Disclaimer
The information and publications are not meant to be, and do not constitute, financial, investment, trading, or other types of advice or recommendations supplied or endorsed by TradingView. Read more in the Terms of Use.