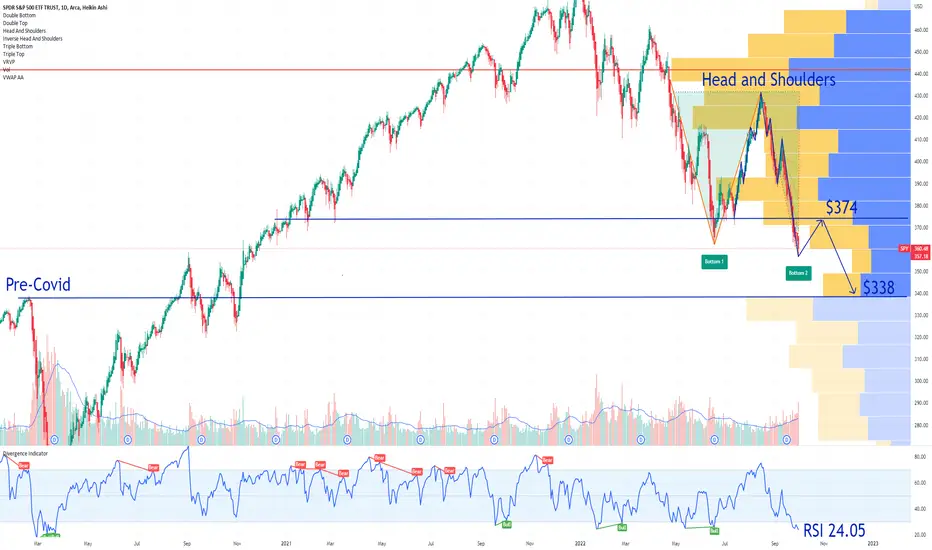
If you haven`t shorted the SPY Head and Shoulders Pattern:
Then you should know that a technical rebound refers to a recovery from a prior period of losses when technical signals indicate that the move was oversold.
In this case, the Relative Strength Index momentum indicator of SPY S&P 500 ETF is at 24.05 on a Double Bottom Reversal Chart Pattern.
A double bottom is a reversal chart pattern in technical analysis that describes a change in trend.
Even though i am overall bearish on the economy, buying a strong financial instrument when the RSI is below 30, would make a case for a potential short term reversal.
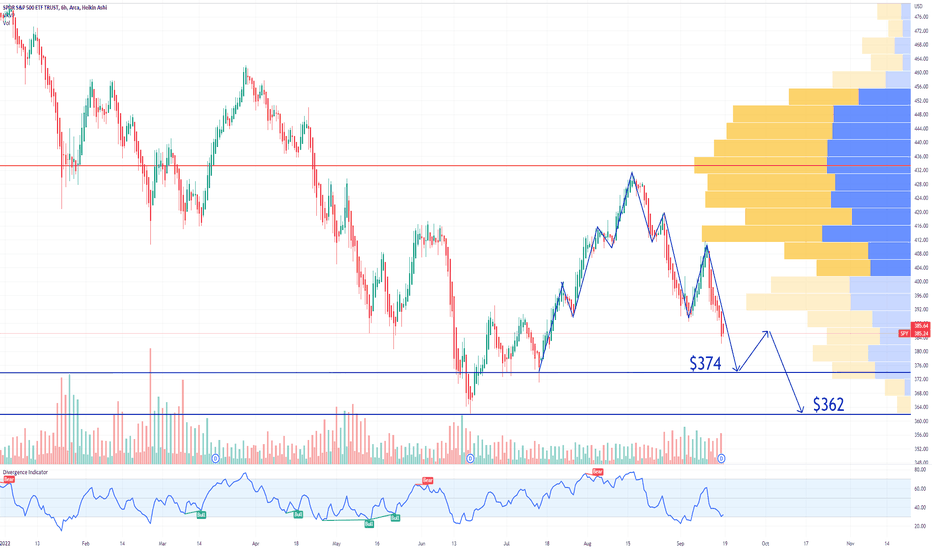
My ultimate price target is $338, but for now i am bullish.
Looking forward to read your opinion about it.
Then you should know that a technical rebound refers to a recovery from a prior period of losses when technical signals indicate that the move was oversold.
In this case, the Relative Strength Index momentum indicator of SPY S&P 500 ETF is at 24.05 on a Double Bottom Reversal Chart Pattern.
A double bottom is a reversal chart pattern in technical analysis that describes a change in trend.
Even though i am overall bearish on the economy, buying a strong financial instrument when the RSI is below 30, would make a case for a potential short term reversal.
My ultimate price target is $338, but for now i am bullish.
Looking forward to read your opinion about it.
Private SIGNALS patreon.com/PremiumOptionsSignals
Trading COURSE bit.ly/tradex
RESULTS bit.ly/TG10x
TradeNation bit.ly/t10X
CRYPTO partner.bybit.com/b/37880
BUY-SELL INDICATORS tradingindicators.store/
Trading COURSE bit.ly/tradex
RESULTS bit.ly/TG10x
TradeNation bit.ly/t10X
CRYPTO partner.bybit.com/b/37880
BUY-SELL INDICATORS tradingindicators.store/
Disclaimer
The information and publications are not meant to be, and do not constitute, financial, investment, trading, or other types of advice or recommendations supplied or endorsed by TradingView. Read more in the Terms of Use.