Chart Type & Timeframe
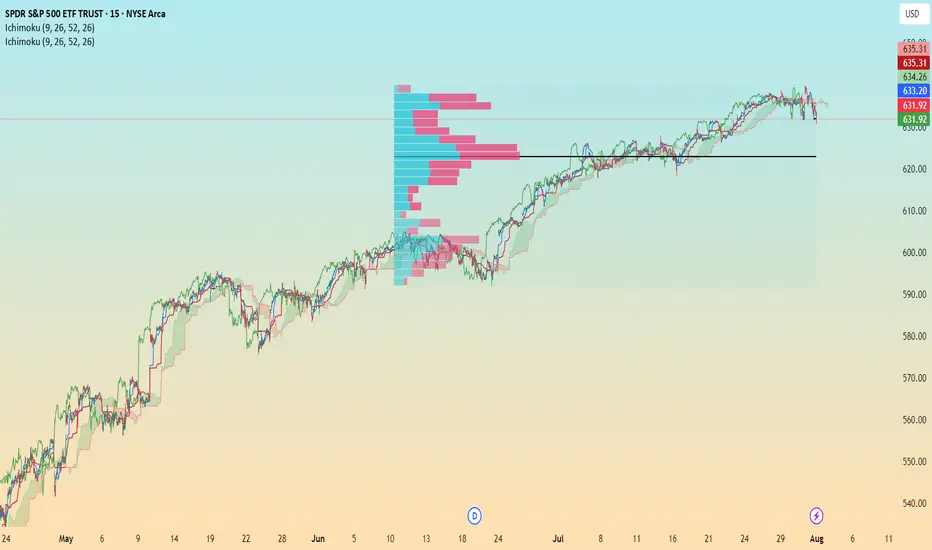
Ticker: SPY (SPDR S&P 500 ETF TRUST)
Exchange: NYSE Arca
Timeframe: 15-minute chart
Date: August 1, 2025
Tools used: Ichimoku Cloud, Volume Profile (Visible Range), Price Action
📌 Key Observations
1. Price Structure & Trend
Overall trend: Strong bullish uptrend from early May to late July.
Current structure: Minor correction from recent highs, testing the lower bounds of the latest uptrend channel.
Support: Horizontal support around the 623–625 range (black line) appears critical — coinciding with the high volume node (HVN) from the volume profile.
2. Volume Profile (VPVR)
High Volume Node (HVN): Between 622 and 626 — significant consolidation happened here, indicating a strong base.
Low Volume Gaps: Above current price — any drop may accelerate toward 625 due to thinner volume.
3. Ichimoku Cloud
Price Position: Currently near the lower edge of the cloud, showing early bearish pressure.
Future Cloud: Flat and narrowing — suggesting indecision or a possible trend reversal.
Conversion & Base lines: Twisting and converging — further hinting at possible consolidation or reversal.
4. Possible Market Structure Shift
Potential Break of Structure (BOS) if price closes below the 630 level on high volume.
Would confirm short-term bearish sentiment and invite deeper retracement.
⚠️ Bearish Signals
Price dipped below Ichimoku cloud and seems to be testing it from below.
Short-term pullback is in play after a prolonged uptrend.
Strong rejection seen from around 635–636.
Price failing to stay above previous swing highs.
🛑 Key Levels to Watch
Level Type Significance
635–636 Resistance Recent highs, price rejected strongly here
630 Intraday Support Break below may lead to further downside
625–623 Strong Support Volume profile HVN + historical consolidation
618–620 Demand Zone If price breaks 625, this is next possible bounce area
✅ What Bulls Want
Price to reclaim 635+, confirm continuation.
Hold above Ichimoku cloud and convert recent sell-off into a higher low.
🔻 What Bears Want
Breakdown below 630, test of 625.
Continuation toward 618 for a full retrace to prior range.
♦JOIN FREE TELEGRAM CHANNEL✅
🔗 t.me/+4JhbHmt-Lf41NzZk
✅FOREX AND GOLD/XAUUSD SIGNALS
✅98% ACCURATE SIGNALS
✅4-6 signals daily 💯💯
♦♦Join telegram Group♦♦
🔗 t.me/+4JhbHmt-Lf41NzZk
🔗 t.me/+4JhbHmt-Lf41NzZk
✅FOREX AND GOLD/XAUUSD SIGNALS
✅98% ACCURATE SIGNALS
✅4-6 signals daily 💯💯
♦♦Join telegram Group♦♦
🔗 t.me/+4JhbHmt-Lf41NzZk
Disclaimer
The information and publications are not meant to be, and do not constitute, financial, investment, trading, or other types of advice or recommendations supplied or endorsed by TradingView. Read more in the Terms of Use.