🔥 SPY Price Thesis – Breakout or Breakdown Setup
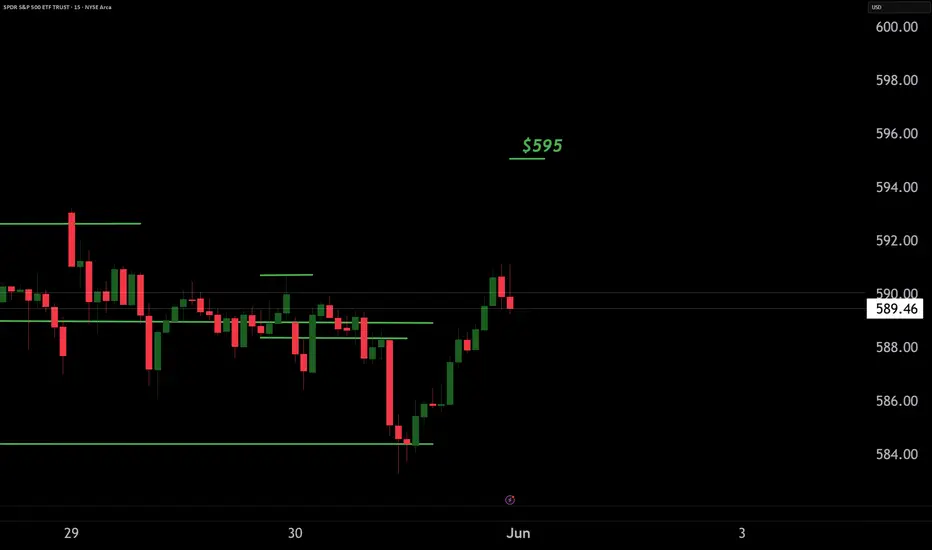
SPY is setting up for a potential breakout above the $595 extension level, with upside to $602–$608. However, $582 remains a key support. A break below $582 could trigger a momentum flush to $567.
Level
🔵 $595.60 – Fib Extension (161.8%) from the March → April swing High-probability breakout trigger
🟢 $602.40 – $608.20 – Fib 200% and exhaustion zone from the same swing Final extension if bullish momentum sustains
🟡 $582.00 – Institutional VWAP reaccumulation zone Strong demand/support
🔴 $567.40 – Prior weekly pivot low + anchored VWAP bounce level Breakdown target if $582 fails
Trend Signal: Bullish bias confirmed — Higher Highs + EMA Cloud still pointing up
Momentum: MACD Histogram turning back up, crossover brewing
Volume: Above average on green days; no true distribution yet
Supertrend Zone: Still green on 4H and 1D
Custom Signal Confluence Score: > 75% (Strong Buy Zone aligning above $588)
🔁 Fibonacci Analysis
Measured from April swing low (~$505) to May high (~$573):
🔹 161.8% = $595.60
🔹 200% = $602.40
🔹 261.8% = $608.20 (max extension target)
📉 On Breakdown:
From $573 high to $558 retracement low:
0.618 retrace = $582.00 ← Current support zone
Full retrace & bear trap zone = $567.40
Smart Money Strategy:
Above $595: Long breakout entries (Calls, zero DTE)
Below $582: Hedge with Puts or inverse ETF
Key Catalyst Triggers: Jobs data, CPI, or Fed commentary could force the move
As Always Safe Trades and JoeWtrades
3 Free Institutional Grade Signals Daily
(t.me/JoeWtrade)
Trading Signals
Coaching Private Stock Community
Option Plays ,Scalp
Day Trading , & Swing Trading
Live Trading
(t.me/JoeWtrade)
Trading Signals
Coaching Private Stock Community
Option Plays ,Scalp
Day Trading , & Swing Trading
Live Trading
Disclaimer
The information and publications are not meant to be, and do not constitute, financial, investment, trading, or other types of advice or recommendations supplied or endorsed by TradingView. Read more in the Terms of Use.