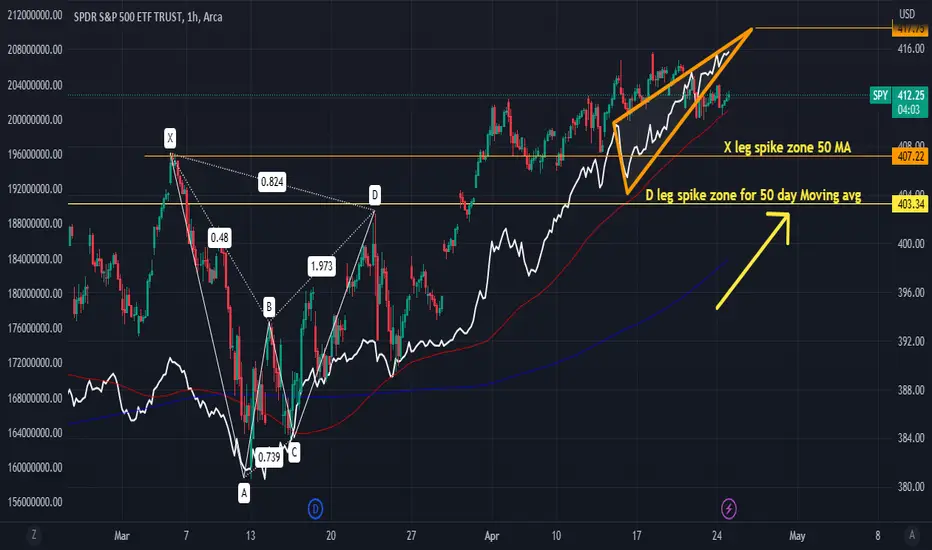
The 50 Day Moving avg is looking to cross both D leg, and X leg of the Bearish Cypher pattern. These are past resistances levels, once both these levels are crossed over. I fully anticipate price action to go higher. In Fact the AD has an ascending Triangle Pattern to 417 on the 1hr time frame. For short term traders and swing traders this is a bullish set up
Note
everything coincides with previous chart and everything has remain in the upward channel Note
Note
looking for the 50 day ma to continue the upward trend and cross over X leg resistances, You saw the spike once it crossed over D leg resistances. and D leg previous resistance level became support.Note
since I know this is heading to 475, long term in play. with continuous bat like patterns w/ folks taking profits on theNote
417-420 likely dump/correction area for retrace back to X leg right before 50 moving crosses over and gives spike to 430 potential run .. will take time to unfold if theory is true likely summer end of june. i'll come back and see if this has retrace to 407 Note
this is what I mean by continuation patterns, and how I see profits. look at these multiple bat type patterns structures being created. Note
i'll make a separate post about thatRelated publications
Disclaimer
The information and publications are not meant to be, and do not constitute, financial, investment, trading, or other types of advice or recommendations supplied or endorsed by TradingView. Read more in the Terms of Use.
Related publications
Disclaimer
The information and publications are not meant to be, and do not constitute, financial, investment, trading, or other types of advice or recommendations supplied or endorsed by TradingView. Read more in the Terms of Use.