
An interesting correlation to say the least. Uncertain if chart is based on anything significant or simply an odd coincidence.
Note
Correction to count in chart. I’m considering republishing it to be interactive. Here’s the accurate EW count overlaid on the volume. Wave 3 is 1.854 wave 1. Wave 5 is 2.618 Wave 1. The teal colored date marks top of wave 5. Shows that correction retraced to Wave 2.Note
1.856*Note
Date of volume Wave 1 top is 28 Aug 06, Wave 3 is 26 Nov 07. The white colored dates are shown in original charts.Note
Note
If you like this idea then check out the one linked below. I originally published this idea in June but republished it in early Aug to include the continued rally thru to end of July. The below idea aligns perfectly with this idea, especially the comparison to 2000-2008 chart shares in the previous update. In other words, below idea identifies 2000 as a wave 3 to 2008’s wave 5 and similarly identifies Sept 19 as a wave 3 to July’s wave 5. It also overlays a corresponding Wyckoff distribution cycle.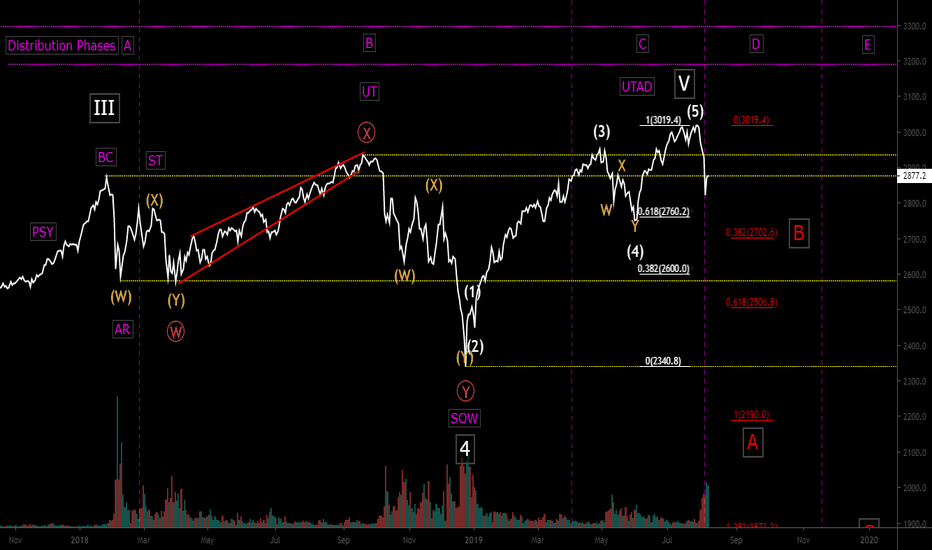
Note
Sorry, confusion on my part. The linked idea above does not include my 2000-2008 EW count, but it does the one for Sept and July. I’ve done too many EW counts identifying ~2000 as a wave 3 and ~2008 as wave 5 that I forget in which ideas I’ve shared them!Note
Volume profile up and price down. Price confirmed downwards breakout.Note
Mobile TV skewed my graphs once again. Here’s a better view of the red wedge from previous chart showing confirmation of downwards breakout.Related publications
Disclaimer
The information and publications are not meant to be, and do not constitute, financial, investment, trading, or other types of advice or recommendations supplied or endorsed by TradingView. Read more in the Terms of Use.
Related publications
Disclaimer
The information and publications are not meant to be, and do not constitute, financial, investment, trading, or other types of advice or recommendations supplied or endorsed by TradingView. Read more in the Terms of Use.