SPX Technical Update – Bearish Watch
Chart Focus: S&P 500 Index (30-Min Chart)
Date: July 21, 2025
🧠 Pattern Watch: Classic Head & Shoulders Formation
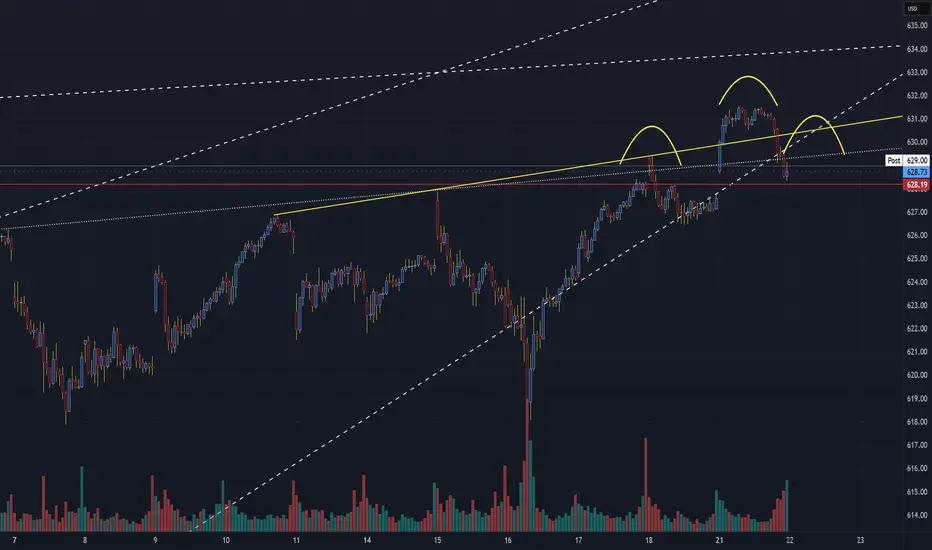
A clear head and shoulders pattern has emerged on the short-term 30-minute chart, signaling a potential bearish reversal after the recent uptrend.
Left Shoulder: Around 630.75
Head: Peaked near 633.00
Right Shoulder: Capped just under 631.00
Neckline: Sits near the 628.75–628.20 zone, marked by a yellow upward-sloping trendline and tested support.
📉 Bearish Breakdown in Play
The price has now broken below the neckline zone at 628.75 with increasing volume — an early confirmation of a bearish break.
The break beneath the rising wedge support and neckline suggests increased downside risk in the near term.
🧭 Technical Levels to Watch
Key Level Type Action
633.00 Resistance (Head) Likely capped unless strong reversal
631.00 Resistance Right shoulder, overhead rejection
628.75 Neckline Support (Broken) Bearish trigger zone
628.20 Intraday support Final support test (now resistance)
625.50 Initial Target Breakdown projection
622.75 Lower Support Measured move target zone
📌 Measured Move Projection:
A break of ~4.5 points from head to neckline projects a target near 624–625 in the near term.
📊 Volume Profile Note
Volume expanded on the neckline break, supporting the validity of the pattern.
Recent bars show a rise in selling pressure as bulls failed to reclaim above 630 after the breakdown.
🔍 Summary Outlook
Bearish Bias: Valid while below 628.75 neckline resistance.
Invalidation Zone: A sustained close above 631.00 would invalidate the bearish pattern.
Watch for Retest: Any bounce into 628.75–629.25 could act as a retest and fade opportunity.
📆 Next Steps:
Short-term traders should monitor price action around 625.50 and 622.75 as the most likely zones for support. Watch for further confirmation with broader index weakness or macro catalysts.
Chart Focus: S&P 500 Index (30-Min Chart)
Date: July 21, 2025
🧠 Pattern Watch: Classic Head & Shoulders Formation
A clear head and shoulders pattern has emerged on the short-term 30-minute chart, signaling a potential bearish reversal after the recent uptrend.
Left Shoulder: Around 630.75
Head: Peaked near 633.00
Right Shoulder: Capped just under 631.00
Neckline: Sits near the 628.75–628.20 zone, marked by a yellow upward-sloping trendline and tested support.
📉 Bearish Breakdown in Play
The price has now broken below the neckline zone at 628.75 with increasing volume — an early confirmation of a bearish break.
The break beneath the rising wedge support and neckline suggests increased downside risk in the near term.
🧭 Technical Levels to Watch
Key Level Type Action
633.00 Resistance (Head) Likely capped unless strong reversal
631.00 Resistance Right shoulder, overhead rejection
628.75 Neckline Support (Broken) Bearish trigger zone
628.20 Intraday support Final support test (now resistance)
625.50 Initial Target Breakdown projection
622.75 Lower Support Measured move target zone
📌 Measured Move Projection:
A break of ~4.5 points from head to neckline projects a target near 624–625 in the near term.
📊 Volume Profile Note
Volume expanded on the neckline break, supporting the validity of the pattern.
Recent bars show a rise in selling pressure as bulls failed to reclaim above 630 after the breakdown.
🔍 Summary Outlook
Bearish Bias: Valid while below 628.75 neckline resistance.
Invalidation Zone: A sustained close above 631.00 would invalidate the bearish pattern.
Watch for Retest: Any bounce into 628.75–629.25 could act as a retest and fade opportunity.
📆 Next Steps:
Short-term traders should monitor price action around 625.50 and 622.75 as the most likely zones for support. Watch for further confirmation with broader index weakness or macro catalysts.
Trade active
Trade closed: stop reached
Disclaimer
The information and publications are not meant to be, and do not constitute, financial, investment, trading, or other types of advice or recommendations supplied or endorsed by TradingView. Read more in the Terms of Use.
Disclaimer
The information and publications are not meant to be, and do not constitute, financial, investment, trading, or other types of advice or recommendations supplied or endorsed by TradingView. Read more in the Terms of Use.