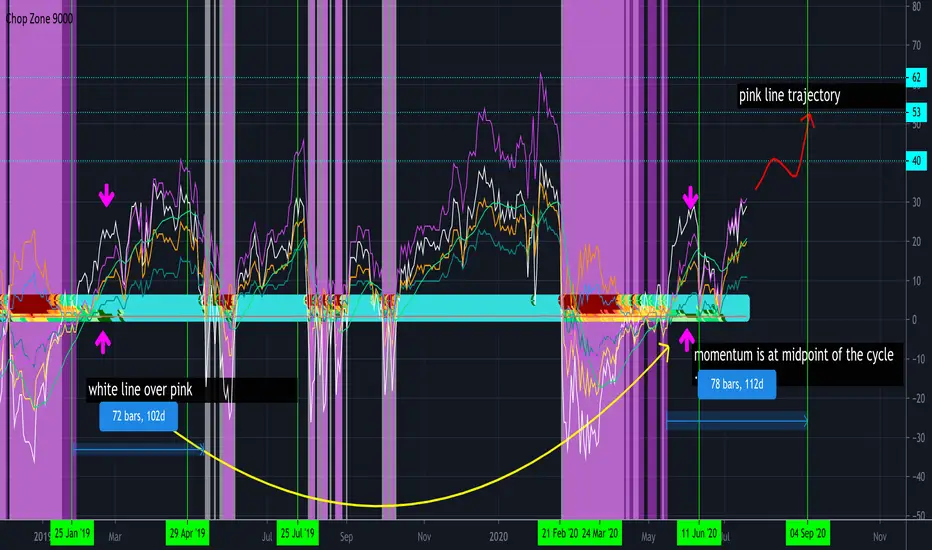
These lines represent the plotted EMA angles of SPY(close, 100) and SPY(close, 200). What is interesting about the current cycle is that it is behaving exactly like the cycle from 2019 ---where the white line begins higher than the pink at the beginning. This pink line is nothing more than the (difference) between between the other lines. If things continue as they have in the past, I expect this market to run bullish until Sept-- which is approximately 100 days of green. It appears that 100 days (or 3 months) has been the holding period lately before everyone takes profit.
Note
Note
Also no signs of market tops yet.
Still more upside to go!
Note
historic market tops
Disclaimer
The information and publications are not meant to be, and do not constitute, financial, investment, trading, or other types of advice or recommendations supplied or endorsed by TradingView. Read more in the Terms of Use.
Disclaimer
The information and publications are not meant to be, and do not constitute, financial, investment, trading, or other types of advice or recommendations supplied or endorsed by TradingView. Read more in the Terms of Use.