🖼 Daily Technical Picture 📈
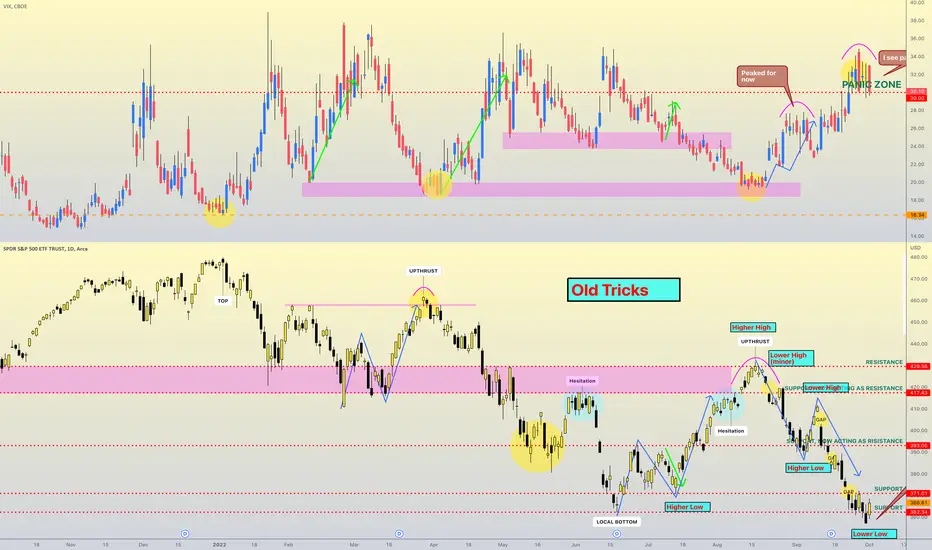
➤ Wallstreet pulled out the oldest trick in the trading book to start off a new month: a fake breakout. A breakout occurs when price confidently breaks through a support or resistance level and closes beyond that level. This is what occurred on 30th Sept to set a new yearly low for the S&P500. Once the price breaks out, it tends to keep moving in that direction except when it doesn't. That's why Trading is so difficult.
➤ Luckily for me, the breakout faded and I recouped a lot of the recent losses. I took off most of my positions too. The price is back in the chop zone between supports. I don't particularly fancy choppy conditions.
➤ The Bulls will be keen to point out this price action is laying the foundation for a double-bottom formation. It's too early to tell. Certainly, there is pent up buying. This type of formation is usually symmetrical i.e. the left and the right bottoms look similar. This would mean it will need to spend some time around the support zones to build the right bottom.
➤ My current exposure is +20% in NASDAQ. I'll give it a day or so more to catch up to other indices as it lagged on this surge. I don't want to be involved holding European indices at the moment as they are trading below the resistance level. The maximum portfolio exposure is +/- 200% on capital, the level of highest conviction.
➤ Conclusion: New month, new beginnings...it certainly is so far.
🏆 eToro Popular Investor 💰
✅ Copy My Trades @ eToro, etoro.com/people/mrstocky
✅ Verified Track Record 📈
Not Investment Advice
✅ Copy My Trades @ eToro, etoro.com/people/mrstocky
✅ Verified Track Record 📈
Not Investment Advice
Disclaimer
The information and publications are not meant to be, and do not constitute, financial, investment, trading, or other types of advice or recommendations supplied or endorsed by TradingView. Read more in the Terms of Use.