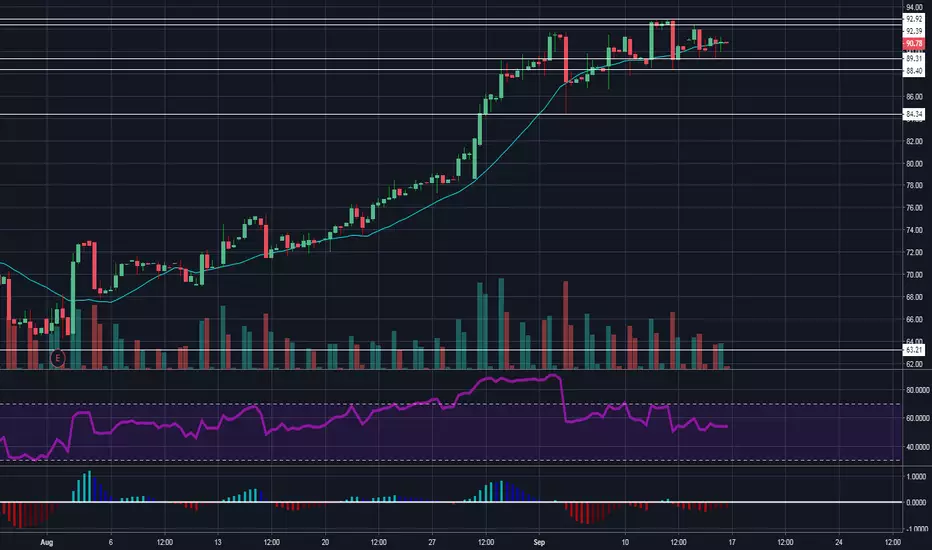
SQ 4hr chart equilibrium break will give direction for the coming week - breaking up above 92.39 increases confidence in continuation to new all time highs this week, and a break of 89.31 will have us looking to test 83.34 as a daily support. The weekly chart is getting extended with 6 green weeks in a row and a bearish reversal spinning top doji on declining bull volume. If we do lose daily support, consolidation on the weekly would be very healthy so long as the bulls can hold the MA20, somewhere around $70 next week, and do it on decreasing bear volume. Weekly support is 63.21 and is nowhere near at risk of being lost
Disclaimer
The information and publications are not meant to be, and do not constitute, financial, investment, trading, or other types of advice or recommendations supplied or endorsed by TradingView. Read more in the Terms of Use.
Disclaimer
The information and publications are not meant to be, and do not constitute, financial, investment, trading, or other types of advice or recommendations supplied or endorsed by TradingView. Read more in the Terms of Use.