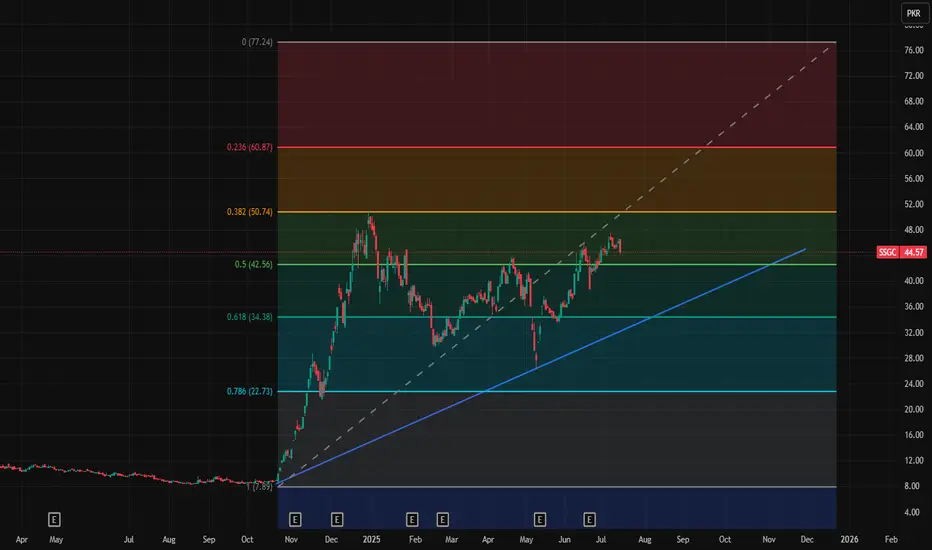
This is SSGC daily chart and you can watch blue trend line is its strong support and sustainability. It is growing day by day in long term.
These are key levels 34.38, 42.58, 50.74, 60.87 and 77.24
Note: This is not a buy/sell trade call. It is an analysis.
These are key levels 34.38, 42.58, 50.74, 60.87 and 77.24
Note: This is not a buy/sell trade call. It is an analysis.
Disclaimer
The information and publications are not meant to be, and do not constitute, financial, investment, trading, or other types of advice or recommendations supplied or endorsed by TradingView. Read more in the Terms of Use.
Disclaimer
The information and publications are not meant to be, and do not constitute, financial, investment, trading, or other types of advice or recommendations supplied or endorsed by TradingView. Read more in the Terms of Use.