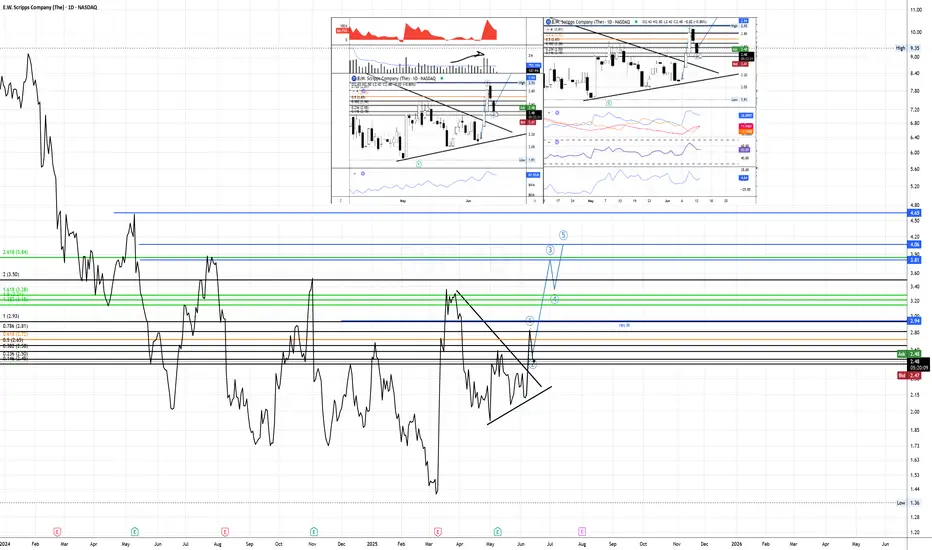
Firstly, on the line chart is possible to watch the possible targets - blue lines - which one of it is almost as the same level as 2,618.
Fibonacci measured from the breakout to monthly resistance.
res M = monthly resistance
During the Wave 2, the two candles from last two days showed low volume as usual to happen during formation of W2, and it is possible to see that price at the breakout and after it was above average which can be read as high interest from buyers.
Confirming the volume, the EFI even though is decreasing still show strength,OBV follow the price trend but looks like buyers are entering again.
When it comes to momentum is possible to see that RSI did not crossed the equilibrium even after two bearish days, as ROC being a leading indicator which already changed direction . ADX is showing some strength for the trend direction confirmed by as DMI+ is still above DMI-
DTC = 1,36
Trade active
To add that in the last 9 years, June and July both showed positive average returns and both had more than 50% positive returns however there was considerable volatility as indicated by standard deviations above 10
Note
A clearer view of the positioning of the blue lines that is not noticeable in the line chart
Follow the social network, free telegram link: t.me/afcapital21
Instagram: afcapital
Instagram: afcapital
Disclaimer
The information and publications are not meant to be, and do not constitute, financial, investment, trading, or other types of advice or recommendations supplied or endorsed by TradingView. Read more in the Terms of Use.